NCHS: A Blog of the National Center for Health Statistics
QuickStats: Percentage of Adults Aged ≥18 Years Who Have Been Bothered a Lot by Headache or Migraine in the Past 3 Months, by Sex and Age Group — National Health Interview Survey, 2021
In 2021, 4.3% of adults aged ≥18 years reported being bothered a lot by headache or migraine in the past 3 months with the percentage among women (6.2%) higher than that among men (2.2%). Percentages were higher among women than men in all age groups: 7.4% versus 2.5% in adults aged 18–44 years, 6.7% versus Read More >
Posted on byU.S. Teen Birth Rate Reached Another Historic Low in 2022
The teen birth rate in the United States decreased 3% from 2021, reaching a record low for this age group. The 2022 rates declined for both younger (ages 15–17) and older (ages 18–19) teenagers. The teen birth rate has declined every year except for two (2006 and 2007) since 1991. The new report, “Births: Provisional Read More >
Posted on byQuickStats: Age-Adjusted Percentage of Adults Aged ≥18 Years Who Take Prescription Medication for Depression, by Sex and Race and Hispanic Origin — National Health Interview Survey, United States, 2021
In 2021, among adults aged ≥18 years, women were more likely to take prescription medication for depression than were men (13.8% versus 7%). This pattern was found among non-Hispanic White (White) (18.1% versus 8.5%) and Hispanic or Latino (8.0% versus 3.7%) adults, but differences by sex were not statistically significant among non-Hispanic Black or African Read More >
Posted on byQuickStats: Percentage of Children and Adolescents Aged 5–17 Years Who Received Free or Reduced-Cost Meals at School During the Previous 12 Months, by Race and Hispanic Ethnicity and Family Income — National Health Interview Survey, United States, 2021
In 2021, 51.6% of all U.S. children and adolescents aged 5–17 years received free or reduced-cost meals at school during the previous 12 months; NH Black or African American (66.2%) and Hispanic or Latino (Hispanic) (64.4%) children and adolescents were more likely to receive free or reduced-cost meals at school than were NH White (42.7%) Read More >
Posted on byProvisional Data Shows U.S. Drug Overdose Deaths Top 100,000 in 2022
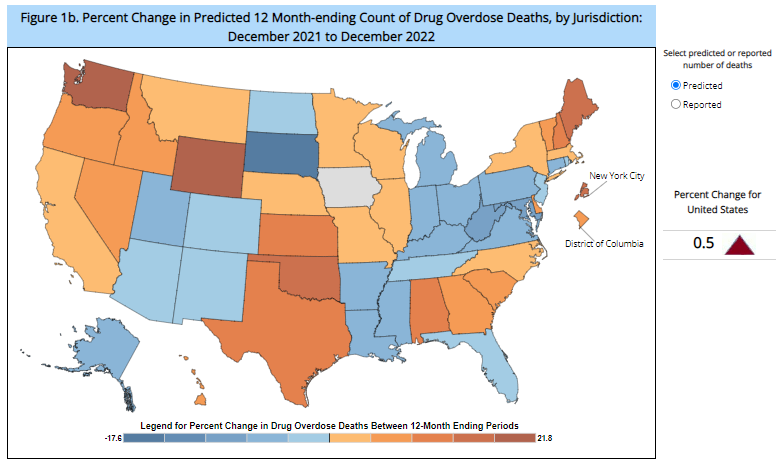
NCHS released the next set of monthly provisional drug overdose death counts that provide data through December 2022. The monthly counts are released under the Vital Statistics Rapid Release program as an interactive data visualization and are available at https://www.cdc.gov/nchs/products/vsrr/drug-overdose-data.htm. Findings: Provisional data show that the reported number of drug overdose deaths occurring in the Read More >
Posted on byU.S. Uninsured Rate Dropped 18% During Pandemic
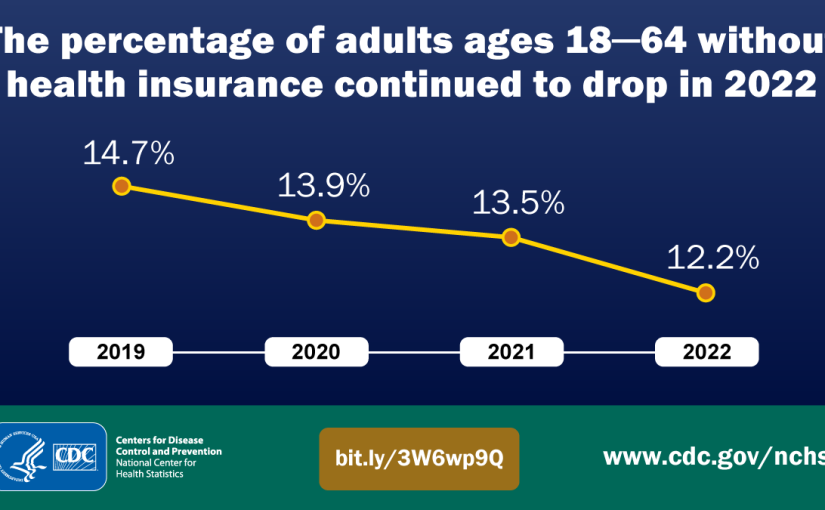
The overall number of Americans without health insurance dropped by 5.6 million from 2019 to 2022. These findings are included in a new report released by CDC’s National Center for Health Statistics (NCHS). The findings are featured in the report, “Health Insurance Coverage: Early Release of Estimates from the National Health Interview Survey, 2022.” It Read More >
Posted on byQuickStats: Age-Adjusted Percentage of Adults Aged ≥18 Years Who Had a Repetitive Strain Injury During the Past 3 Months, by Sex and Race and Hispanic Origin
In 2021, 9.0% of men and 8.9% of women aged ≥18 years had a repetitive strain injury during the past 3 months. Non-Hispanic White men (10.1%) were more likely to have a repetitive strain injury than were non-Hispanic Asian (Asian) (7.6%), non-Hispanic Black or African American (Black) (6.6%), and Hispanic or Latino (Hispanic) (6.4%) men. Read More >
Posted on byNew Updates to Interactive “Stats of the States” Page
The CDC National Center for Health Statistics web page “Stats of the States” has been updated to include the latest state-based final data on selected vital statistics topics, including: General fertility rates Teen birth rates Selected other maternal and infant health measures Marriage & divorce rates Leading causes of death Other high profile causes of Read More >
Posted on byQuickStats: Percentage of Adults Who Were in Families Having Problems Paying Medical Bills During the Previous 12 Months, by Race, Hispanic Origin, and Selected Asian Subgroups
During 2020–2021, the percentage of U.S. adults who were in families having problems paying medical bills during the previous 12 months was 11.3%. Non-Hispanic Asian adults (5.7%) were the least likely to be in families having problems paying medical bills, followed by non-Hispanic White (10%), Hispanic or Latino (13.5%), and non-Hispanic Black or African American Read More >
Posted on byFentanyl Overdose Death Rates More Than Tripled From 2016 to 2021
Drug overdose death rates involving fentanyl increased by 279% from 5.7 per 100,000 in 2016 to 21.6 in 2021, according to new data from the CDC’s National Center for Health Statistics (NCHS). Drug overdose death rates involving methamphetamine more than quadrupled during the same period. “Rapid Release Estimates of Drug Overdose Deaths involving Fentanyl, Methamphetamine, Read More >
Posted on byQuickStats: Percentage of Currently Employed Adults Aged ≥18 Years Who Have Paid Sick Leave by Education Level — National Health Interview Survey, 2021
In 2021, 72.5% of employed adults had paid sick leave. The percentage with sick leave was highest among workers with a bachelor’s degree or higher (83.6%), followed by workers with an associate degree (73.2%). The percentage of sick leave was similar for workers with some college (66.3%) and those with a high school diploma or Read More >
Posted on byQuickStats: Percentage of Adults Who Were in Families Having Problems Paying Medical Bills During the Previous 12 Months, by Race and Selected Hispanic Origin Subgroups — National Health Interview Survey, United States, 2020−2021
During 2020–2021, the percentage of U.S. adults who were in families having problems paying medical bills during the previous 12 months was 11.3%. Non-Hispanic Black or African American adults (16.8%) were most likely to be in families having problems paying medical bills followed by Hispanic or Latino (13.5%), non-Hispanic White (10.0%), and non-Hispanic Asian (5.7%) Read More >
Posted on byQ & A from Author of Emergency Department Visits with Suicide Ideation
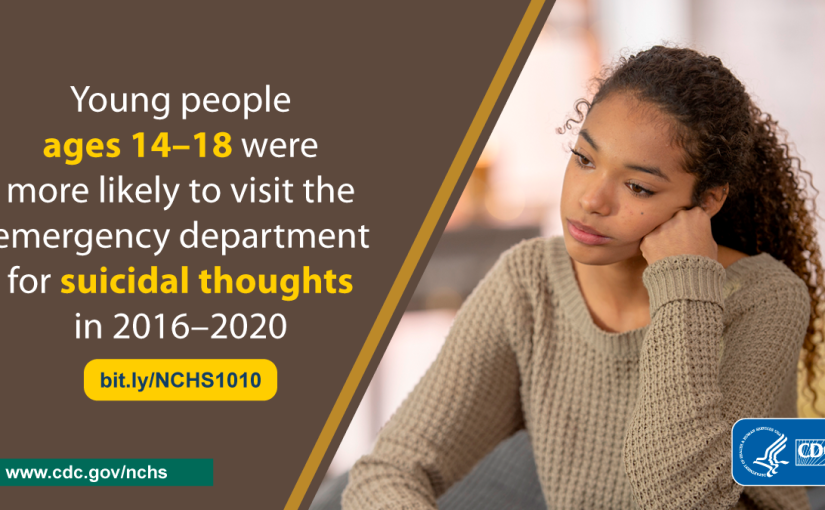
Questions for Alex Strashny, Health Statistician and Lead Author of “Emergency Department Visits with Suicidal Ideation: United States, 2016-2020.” Why did you decide to do a report on emergency department visits with suicidal ideation? That’s a great question. Suicide is a major public health issue. Before to the COVID-19 pandemic, in the United States, suicide Read More >
Posted on byU.S. Pregnancy Rates Drop During Last Decade
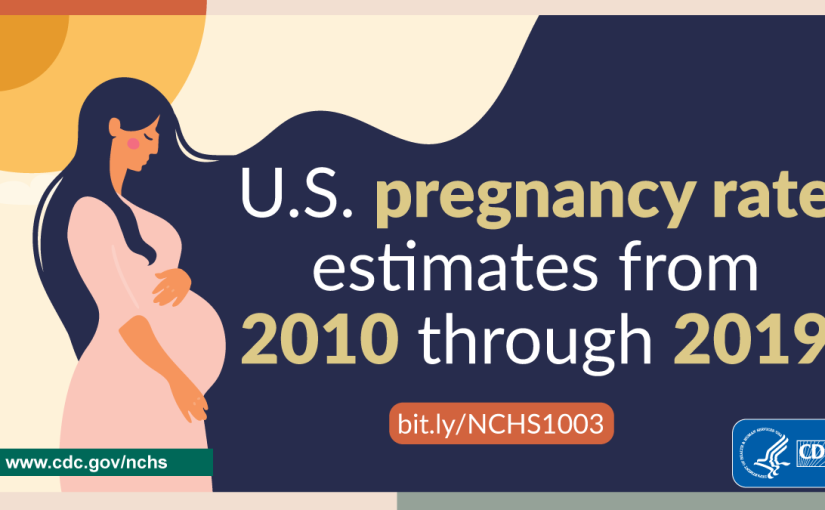
Newly released national pregnancy rate estimates from CDC’s National Center for Health Statistics (NCHS) show declines in the overall and unintended pregnancy rates in the United States for 2010–2019. These are the first pregnancy rate statistics from NCHS since the agency published estimates for 2010 in a report released in 2015. The new report, “Updated Read More >
Posted on byQuickStats: Age-Adjusted Percentage of Adults Aged ≥18 Years with Serious Psychological Distress During the Past 30 Days, by Family Income — National Health Interview Survey, 2021
In 2021, 3.8% of adults aged ≥18 years had serious psychological distress during the past 30 days. The age-adjusted percentage of adults who had serious psychological distress decreased with increasing family income, from 8.9% of adults with family income <100% of FPL, to 5.8% of adults with family income 100%–199% of FPL, to 3.8% of Read More >
Posted on byColon Cancer Deaths in the United States: 1999-2021
Year Deaths Age Adjusted Rate* 1999 48,433 17.7 2000 48,570 17.6 2001 47,860 17 2002 47,586 16.6 2003 46,868 16.1 2004 44,591 15.1 2005 43,989 14.6 2006 44,061 14.3 2007 43,969 14 2008 43,396 13.6 2009 42,199 12.9 2010 42,009 12.6 2011 41,822 12.2 2012 41,488 11.9 2013 41,502 11.6 2014 41,526 11.4 2015 42,126 Read More >
Posted on byQuickStats: Percentage Distribution of Cigarette Smoking Status Among Current Adult E-Cigarette Users, by Age Group — National Health Interview Survey, United States, 2021
In 2021, 4.5% of U.S. adults were current e-cigarette users. Among adult e-cigarette users overall, 29.4% also were current cigarette smokers, 40.3% were former cigarette smokers, and 30.3% had never been cigarette smokers. Among e-cigarette users aged 18–24 years, 16.3% were current smokers, 22.3% were former smokers, and 61.4% had never been cigarette smokers. Among Read More >
Posted on byQuickStats: Percentage of Adults Aged 18–64 Years Who Used Telemedicine in the Past 12 Months, by Sex and Health Insurance Coverage — National Health Interview Survey, United States 2021
Overall, in 2021, 35.3% of adults aged 18–64 years had a telemedicine visit with a health care professional in the past 12 months. The percentage was higher among women than men overall (41.7% versus 28.8%). Women were also more likely than were men to have had a telemedicine visit among those with private health insurance Read More >
Posted on byQ & A from Author of Emergency Department Visits Related to Mental Health Disorders Among Adults, by Race and Hispanic Ethnicity
Q: Why did you decide to report on rates of emergency department (ED) visits for mental health disorders by race and ethnicity? ZP: As mentioned in the introduction of this report, prior research has shown that certain race/ethnicity groups are less likely to receive routine mental health care. Additionally, mental health disorders are frequently diagnosed at ED visits, Read More >
Posted on byQuickStats: Percentage of Adults Aged ≥18 Years with Serious Psychological Distress in the Past 30 Days, by Sex and Age Group — National Health Interview Survey, United States, 2021
In 2021, 3.7% of adults aged ≥18 years had serious psychological distress in the past 30 days with percentages higher among women (4.6%) than among men (2.7%). The higher percentages among women were seen across all age groups: 5.6% versus 3.1% in adults aged 18–44 years, 4.5% versus 2.8% in those aged 45–64 years, and Read More >
Posted on byQuickStats: Percentage of Women Aged 50–74 Years Who Had a Mammogram Within the Preceding 2 Years by Family Income — National Health Interview Survey, United States, 2021
In 2021, 76.0% of women aged 50–74 years reported that they had a mammogram within the preceding 2 years. The percentage of women who had a mammogram within the preceding 2 years increased with family income, from 67.7% of women with family income <200% of federal poverty level (FPL), to 74.3% of women with income Read More >
Posted on byLove is in the Air: Marriages Rebound in 2021

The number of marriages in 2020 was the lowest recorded in the United States since 19631, as many couples had to delay weddings due to the pandemic. However, in 20212 there was a rebound as both the number and rate of marriages were up 18% compared with 2020. The increase in the number and rate of Read More >
Posted on byQuickStats: Percentage of Adults Aged ≥45 Years Who Use a Hearing Aid, by Sex and Age Group — National Health Interview Survey, United States, 2021
In 2021, among adults aged ≥45 years, men were more likely to use a hearing aid than were women (9.2% versus 5.5%). This pattern was found in all age groups: 3.0% of men versus 1.4% of women among those aged 45–64 years, 12.3% versus 5.7% among those aged 65–74 years, 26.7% versus 13.7% among those Read More >
Posted on byNew Detailed Race and Ethnicity Data Query System

NCHS has released a new interactive data query system that allows users to search for data on adults about selected health topics by detailed race and ethnicity groups and subgroups in the United States. The new system provides estimates as three-year averages based on 2019-2021 final data from the National Health Interview Survey (NHIS). The three-year averages Read More >
Posted on byQuickStats: Percentage of Persons Who Used Telemedicine During the Past 12 Months, by Age Group — National Health Interview Survey, United States, 2021
In 2021, approximately one third (32.8%) of persons of all ages had a telemedicine appointment with a doctor, nurse, or other health professional during the past 12 months. The percentage with a telemedicine appointment increased with age, from 17.2% among children aged <10 years to 45.5% among adults aged 70–79 years, and then decreased to Read More >
Posted on by