Category: injury
Q & A from the Report Author of Repetitive Strain Injuries in Adults

Questions for Matthew Garnett, Health Statistician and Lead Author of “Repetitive Strain Injuries in Adults in the Past 3 Months: United States, 2021.” Q: Why did you decide to look at repetitive strain injuries? MG: When people tend to think about injuries, they often think of acute injuries like cuts or broken bones. However, repetitive Read More >
Posted on byQuickStats: Age-Adjusted Percentage of Adults Aged ≥18 Years Who Had a Repetitive Strain Injury During the Past 3 Months, by Sex and Race and Hispanic Origin
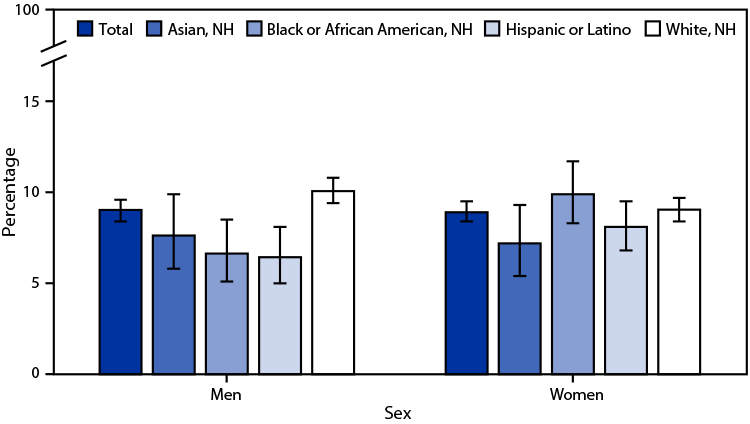
In 2021, 9.0% of men and 8.9% of women aged ≥18 years had a repetitive strain injury during the past 3 months. Non-Hispanic White men (10.1%) were more likely to have a repetitive strain injury than were non-Hispanic Asian (Asian) (7.6%), non-Hispanic Black or African American (Black) (6.6%), and Hispanic or Latino (Hispanic) (6.4%) men. Read More >
Posted on byQuickStats: Death Rates from Unintentional Falls Among Persons Aged ≥65 Years, by Age Group — National Vital Statistics System, United States, 1999–2020
During 1999–2020, death rates from unintentional falls among persons aged ≥65 years increased among all age groups. The largest increase occurred among persons aged ≥85 years, from 110.2 per 100,000 population in 1999 to 291.5 in 2020. Among persons aged 75–84 years, the rate increased from 31.5 to 67.9, and among those aged 65–74 years, Read More >
Posted on byQuickStats: Percentage Distribution of Deaths Involving Injuries from Recreational and Nonrecreational Use of Watercraft, by Month — United States, 2018–2020
During 2018–2020, 1,508 deaths occurred involving injuries from recreational and nonrecreational use of watercraft. The percentage of deaths each month ranged from 3.0% in December to 16.6% in July. Most deaths (68.6%) occurred during May–September. Source: National Vital Statistics System, Mortality Data. https://www.cdc.gov/nchs/nvss/deaths.htm https://www.cdc.gov/mmwr/volumes/71/wr/mm7121a5.htm Read More >
Posted on byQuickStats: Rate of Deaths Attributed to Unintentional Injury from Fire or Flames, by Sex and Urban-Rural Status — National Vital Statistics System, United States, 2020
In 2020, the death rate attributed to unintentional injury from fire or flames was higher in rural areas than in urban areas for females and males. The rate for females was 1.4 per 100,000 in rural areas and 0.6 in urban areas. The rate for males was 2.4 per 100,000 in rural areas and 0.9 Read More >
Posted on byQuickStats: Rate of Unintentional Traumatic Brain Injury–Related Deaths Among Persons Aged ≤19 Years, by Age Group and Sex — National Vital Statistics System, United States, 2018–2020
During 2018–2020, death rates for unintentional traumatic brain injury among persons aged ≤19 years were higher for males than for females in each age group. Rates were highest for males (6.1 per 100,000) and females (2.9) among persons aged 15–19 years. Rates were lowest for males and females aged 5–9 years (1.1 and 0.8, respectively) Read More >
Posted on byConcussions and Brain Injuries in Children: United States, 2020
A new NCHS report presents national estimates of lifetime symptomatology and health care professional diagnoses of concussions or brain injuries as reported by a knowledgeable adult, usually a parent, in children aged 0–17 years using data from the 2020 National Health Interview Survey. Key Findings: In 2020, 6.8% of children aged 17 years and under Read More >
Posted on byQ & A with Author: Rural-urban Differences in Unintentional Injury Death Rates Among Children Aged 0-17: United States, 2018-2019
Questions for Matthew Garnett, Health Statistician and Lead Author of “Rural-urban Differences in Unintentional Injury Death Rates Among Children Aged 0-17: United States, 2018-2019.” Q: Can you describe what unintentional injury deaths are? MG: Unintentional injury deaths include fatal injuries that were unintended, unplanned, and did not occur on purpose. In contrast, intentional injuries include Read More >
Posted on byQuickStats: Injury Deaths as a Percentage of Total Deaths, by Age Group — National Vital Statistics System, United States, 2019
Injuries accounted for the majority of deaths among persons aged 15–39 years, with the highest percentages among those aged 15–19 (76.0%) and 20–24 years (78.2%). The percentage of injury deaths was lowest among those aged <1 year (7.9%), 60–64 years (7.5%), and ≥65 years (3.4%). Source: National Center for Health Statistics, National Vital Statistics System, Mortality Read More >
Posted on byQuickStats: Age-Adjusted Death Rates for Four Selected Mechanisms of Injury — National Vital Statistics System, United States, 1979–2019
In 1979, of the four mechanisms of injury, age-adjusted mortality rates were highest for motor vehicle traffic deaths and lowest for drug poisoning deaths. From 1979 to 2019, the age-adjusted rate of motor vehicle traffic deaths decreased from 22.1 per 100,000 to 11.1, and the rate of firearm-related deaths decreased from 14.7 to 11.9. During Read More >
Posted on byQuickStats: Rate of Unintentional Traumatic Brain Injury (TBI)–Related Deaths Among Persons Aged 24 Years and Under, by Age Group
From 1999 to 2018, death rates for unintentional TBI among persons aged 24 years and under declined across all age groups. During the 20-year period, TBI-related death rates declined from 3.7 per 100,000 to 1.5 among children aged 0–4 years, from 3.0 to 0.9 for children and adolescents aged 5–14 years, from 14.7 to 4.4 Read More >
Posted on byEmergency Department Visits for Injuries Sustained During Sports and Recreational Activities by Patients Aged 5–24 Years, 2010–2016
Questions for Lead Author Anna Rui, Health Statistician, of “Emergency Department Visits for Injuries Sustained During Sports and Recreational Activities by Patients Aged 5–24 Years, 2010–2016.” Q: What do you think is the most significant finding in this report? AR: The top activities that caused emergency room (ER) visits for sports injuries by patients ages Read More >
Posted on byUnintentional Injury Death Rates in Rural and Urban Areas: United States, 1999–2017
Questions for Lead Author Henry Olaisen, EIS Fellow, of “Unintentional Injury Death Rates in Rural and Urban Areas: United States, 1999–2017.” Q: Can you define what an unintentional injury death is? Is there a difference in the term accidental death? HO: Unintentional injury deaths consist of those deaths involving injuries for which there are no Read More >
Posted on byQuickstats: Rates of Injury from Sports, Recreation, and Leisure Activities Among Children and Adolescents Aged 1–17 Years, by Age Group — National Health Interview Survey, United States, 2015–2017
In 2015–2017, the rate of sports, recreation, and leisure injuries among children and adolescents aged 1–17 years was 82.9 per 1,000 population. The rate of sports, recreation, and leisure injuries increased with age from 48.4 for those aged 1–4 years, to 72.7 for those aged 5–11 years, and to 117.1 for those aged 12–17 years. Read More >
Posted on byQuickStats: Death Rates for Motor Vehicle Traffic Injury, by Age Group — National Vital Statistics System, United States, 2015 and 2017
From 2015 to 2017, death rates for motor vehicle traffic injury increased for persons aged 15 years or older. For infants and children younger than 15 years there was no statistically significant change from 2015 to 2017, and this group had the lowest death rate (2.0 deaths per 100,000) in 2017. The highest death rate Read More >
Posted on byQuickStats: Percentage of Persons of All Ages Who Had a Medically Attended Injury During the Past 3 Months by Age Group
During 2015–2017, 2.8% of persons of all ages had a medically attended injury in the past 3 months, and this varied by age. The percentage who had a medically attended injury increased from 1.8% among those aged less than 10 years to 3.2% among those aged 10–19 years, declined to 2.5% among those aged 20–44 Read More >
Posted on byQuickStats: Percentage of Injury Deaths That Occurred in the Decedent’s Home for the Five Most Common Causes† of Injury Death — United States, 2016
In 2016, 31% of deaths from all causes of injury occurred in the person’s home. The percentage varied by the cause of injury. More than half of the deaths attributable to poisoning (52%) occurred in the home. Approximately 44% of deaths from firearms and suffocation occurred in the home. Source: National Center for Health Statistics, Read More >
Posted on byRecent Increases in Injury Mortality Among Children and Adolescents Aged 10–19 Years in the United States: 1999–2016
NCHS released a new report that presents numbers of injury deaths and death rates for children and adolescents aged 10–19 years in the United States for 1999–2016. Numbers and rates are presented by sex for 1999–2016, by injury intent (e.g., unintentional, suicide, and homicide) and method (e.g., motor vehicle traffic, firearms, and suffocation). Numbers and Read More >
Posted on byParental Report of Significant Head Injuries in Children Aged 3–17 Years: United States, 2016
Questions for Lindsey Black, Health Statistician and Lead Author of “Parental Report of Significant Head Injuries in Children Aged 3–17 Years: United States, 2016.” Q: What was the reason you undertook this research? LB: Previous research has indicated that the incidence is increasing and much of this trend is being driven by an increase among Read More >
Posted on byQuickStats: Percentage of Children and Teens Aged 6–17 Years Who Missed More Than 10 Days of School in the Past 12 Months Because of Illness or Injury, by Serious Emotional or Behavioral Difficulties Status and Age Group
During 2014–2016, children aged 6–17 years whose parent or guardian indicated the child had serious emotional or behavioral difficulties (EBDs) were almost four times as likely to miss more than 10 days of school because of illness or injury compared with children without serious EBDs (13.4% compared with 3.5%). Among children with serious EBDs, those Read More >
Posted on byQuickStats: Percentage of Children and Teens Aged 5–17 Years Who Missed >10 School Days in the Past 12 Months Because of Illness or Injury, by Sex and Age — National Health Interview Survey, 2013–2015
During 2013–2015, 3.9% of boys and 4.3% of girls missed >10 school days in the past 12 months because of illness or injury. Among children aged 15–17 years, girls were more likely than boys to miss >10 school days (6.8% compared with 3.9%). Among girls, those aged 15–17 years were more likely than girls aged Read More >
Posted on byStat of the Day – May 23, 2017
#STATOFTHEDAY 8.6 million sports&recreation injury episodes occur annually in US https://t.co/On3hka4lKz #PhysicalFitnessandSportsMonth — NCHS (@NCHStats) May 23, 2017 Read More >
Posted on bySports and Recreation Related Injury Episodes in the United States, 2011-2014
Questions for Yahtyng Sheu, Senior Service Fellow and Lead Author on “Sports and Recreation Related Injury Episodes in the United States, 2011-2014” Q: How many sports and recreation related injuries are being reported annually? YS: According to our analysis, approximately 8.6 million of sports- and recreation- related injury episodes were reported annually among persons aged Read More >
Posted on byInjury Mortality: United States, 1999–2014
NCHS has released new data visualization that depicts injury mortality in the United States from 1999 through 2014. This storyboard allows the user to select subcategories of injury deaths based on intent and mechanism of injury. Numbers and rates are provided for the subcategory selected by the user. The storyboard includes six dashboards. Deaths can be Read More >
Posted on byNational Hospital Care Survey Demonstration Projects: Traumatic Brain Injury
A new report from NCHS examines traumatic brain injury (TBI) encounters in various hospital settings. While the National Hospital Care Survey (NHCS) data used were not nationally representative, the results presented are consistent with previous research studies. Analyses were conducted to highlight the tremendous analytical capabilities of NHCS, capabilities that have not been available before in previous surveys. New Read More >
Posted on by