Category: MMWR
QuickStats: Percentage of Adults Aged ≥18 Years Who Were in Families Having Problems Paying Medical Bills in the Past 12 Months, by Disability Status and Age Group — United States, 2023
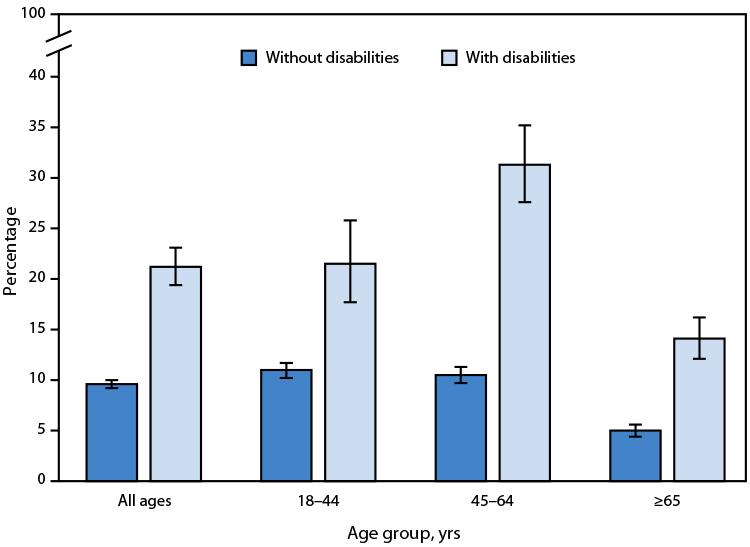
In 2023, the percentage of adults aged ≥18 years who were in families having problems paying medical bills in the past 12 months was higher among those with disabilities (21.2%) compared with those without disabilities (9.6%). This pattern was observed across all age groups. Supplementary Table: https://stacks.cdc.gov/view/cdc/164154 Source: National Center for Health Statistics, National Health Interview Read More >
Posted on byQuickStats: Prevalence of Obesity and Severe Obesity Among Persons Aged 2–19 Years — United States, 1999–2000 Through 2021–2023
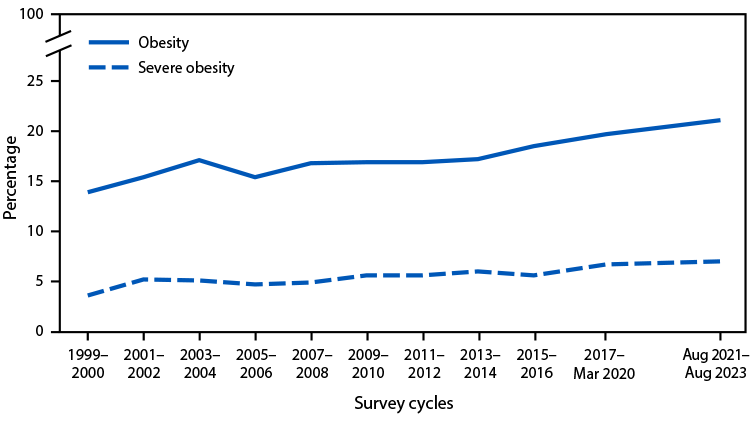
From 1999–2000 through August 2021–August 2023, the prevalence of obesity among persons in the United States aged 2–19 years increased from 13.9% to 21.1%, and the prevalence of severe obesity increased from 3.6% to 7.0%. Supplementary Table: https://stacks.cdc.gov/view/cdc/164014 Source: National Center for Health Statistics, National Health and Nutrition Examination Survey, 1999–2000 through August 2021–August 2023. https://www.cdc.gov/nchs/nhanes/index.htm https://www.cdc.gov/mmwr/volumes/73/wr/mm7341a5.htm Read More >
Posted on byQuickStats: Rates of Emergency Department Visits for Children and Adolescents with Acute Upper Respiratory Infection, by Age Group — United States, 2021–2022
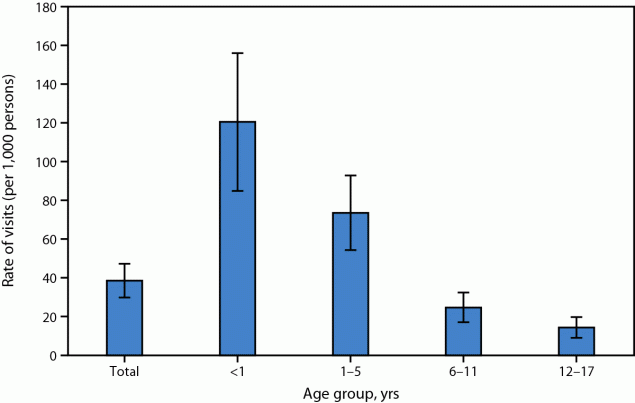
In 2021–2022, the rate for emergency department (ED) visits for children and adolescents with acute upper respiratory infection was 38.6 per 1,000 persons aged <18 years. The ED visit rate was highest for infants aged <1 year (120.5) and decreased by age, with the lowest rate among adolescents aged 12–17 years (14.4). Supplementary Table: https://stacks.cdc.gov/view/cdc/162215 Source: Read More >
Posted on byQuickStats: Percentage of Suicides and Homicides Involving a Firearm Among Persons Aged ≥10 Years, by Age Group — United States, 2022
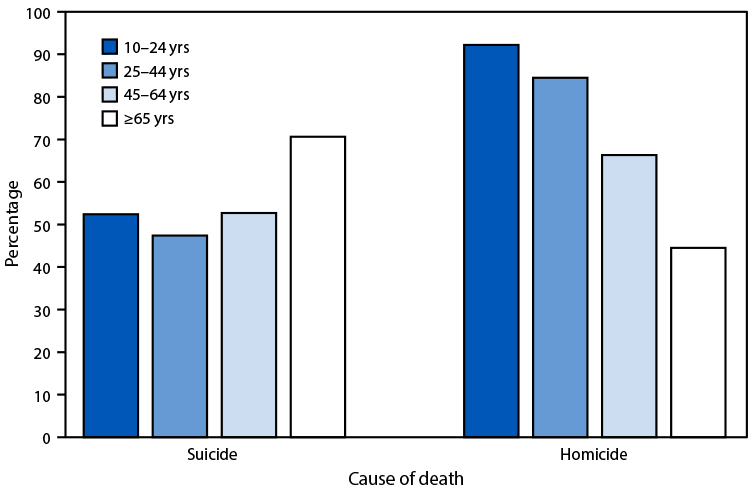
In 2022, among persons aged ≥10 years, the percentage of suicide deaths involving a firearm was lowest among persons aged 25–44 years (47.4%) and highest among persons aged ≥65 years (70.6%). The percentage of homicide deaths that involved a firearm was highest among persons aged 10–24 years and then decreased with age, from 92.2% among Read More >
Posted on byQuickStats: Percentage of Children and Adolescents Aged ≤17 Years Who Used Telemedicine During the Past 12 Months, by Age Group and Year — United States, 2021–2023
The percentage of children and adolescents aged 0–17 years using telemedicine during the past 12 months declined from 18.3% in 2021 to 14.2% in 2023. Telemedicine use declined across all three age groups during this period. In both 2022 and 2023, telemedicine use increased with age. Supplementary Table: https://stacks.cdc.gov/view/cdc/159160 Source: National Center for Health Statistics, National Health Read More >
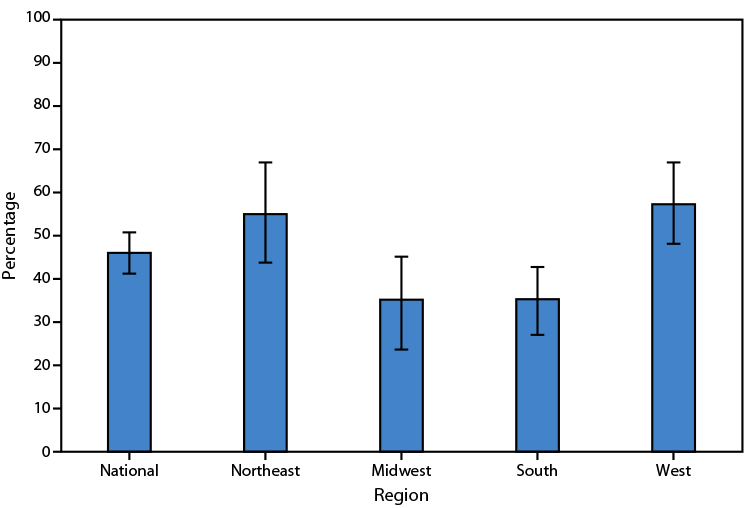
Posted on byQuickStats: Percentage of Adult Day Services Centers That Use Any Telehealth, by U.S. Census Bureau Region — United States, 2022

In 2022, 46% of U.S. adult day services centers used any telehealth tools. Approximately one half of centers in the Northeast and West used any telehealth, compared with approximately one third of centers in the Midwest and South. Supplementary Table: https://stacks.cdc.gov/view/cdc/157543 Source: National Center for Health Statistics, National Post-Acute and Long-Term Care Study, 2022. https://www.cdc.gov/nchs/npals https://www.cdc.gov/mmwr/volumes/73/wr/mm7330a4.htm Read More >
Posted on byQuickStats: Percentage of Current Cigarette Smokers Aged ≥18 Years Who Received Advice from a Health Professional To Quit Smoking, by Sex and Age Group — United States, 2022
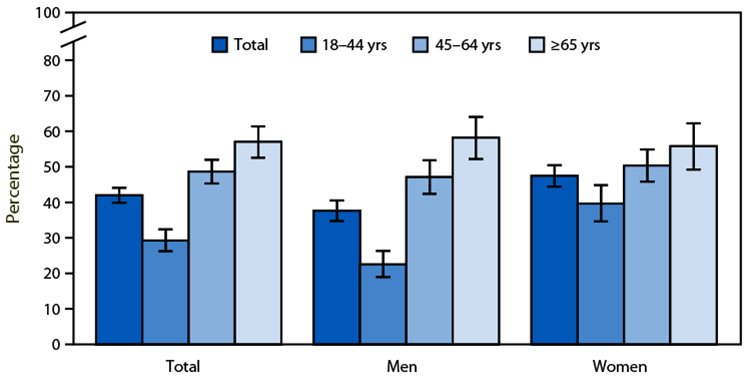
In 2022, 42.0% of current cigarette smokers aged ≥18 years received advice from a doctor, dentist, or other health professional about ways to quit smoking. The percentage of current smokers who received advice to quit smoking increased with age. Overall, and for current smokers aged 18–44 years, men were less likely to receive advice on Read More >
Posted on byQuickStats: Percentage of Adults Aged ≥25 Years Who Met the 2018 Federal Physical Activity Guidelines for Both Muscle-Strengthening and Aerobic Physical Activity, by Educational Attainment — United States, 2022
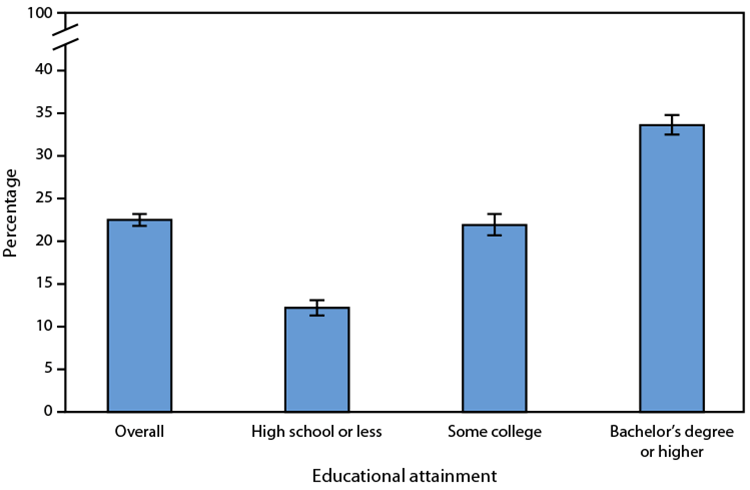
In 2022, 22.5% of adults met federal guidelines for both muscle-strengthening and aerobic physical activity. The percentage of adults who met these guidelines increased with increasing educational attainment, from 12.2% among adults who completed high school or less to 33.6% among those with a bachelor’s degree or higher. Supplementary Table: https://stacks.cdc.gov/view/cdc/155046 Source: National Center for Health Statistics, Read More >
Posted on byQuickStats: Percentage Distribution of Deaths Involving Injuries from Recreational and Nonrecreational Use of Watercraft, by Month — United States, 2020–2022
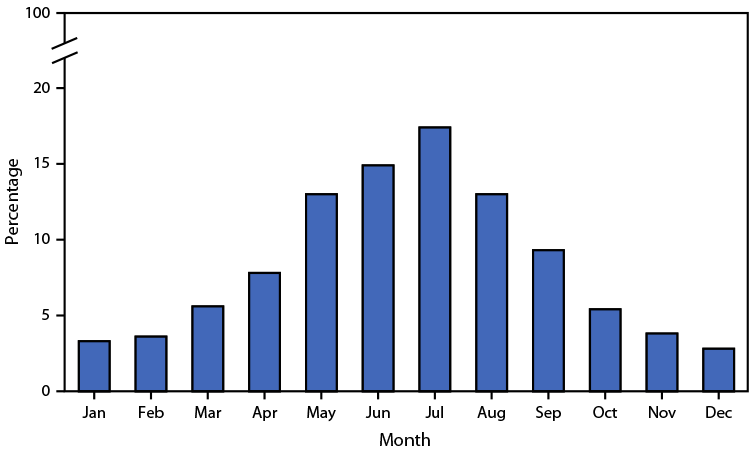
During 2020–2022, a total of 1,481 deaths occurred involving injuries from recreational and nonrecreational use of watercraft. The highest percentage of these deaths (17.4%) occurred in July, with the majority occurring during May–September. Supplementary Table: https://stacks.cdc.gov/view/cdc/155045 Source: National Center for Health Statistics, National Vital Statistics System, Mortality Data, 2020–2022. https://www.cdc.gov/nchs/nvss/deaths.htm Read More >
Posted on byQuickStats: Percentage of Children and Adolescents Aged 5–17 Years Who Had Chronic School Absenteeism Due to Illness, Injury, or Disability During the Past 12 Months, by Age Group and Year — National Health Interview Survey, United States, 2019 and 2022
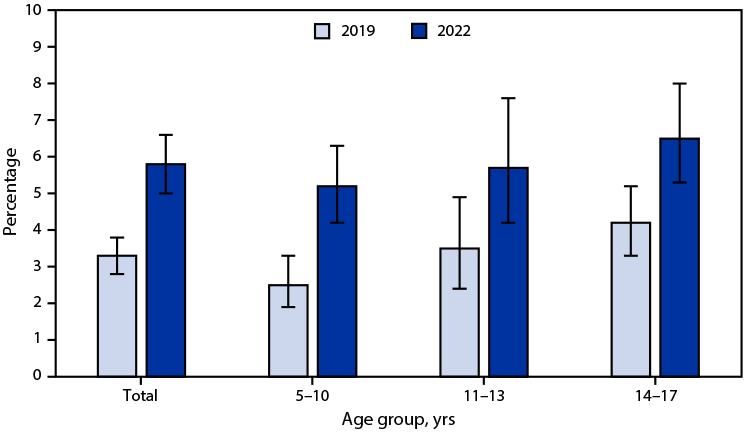
The percentage of children and adolescents aged 5–17 years who had chronic school absenteeism during the past 12 months was higher in 2022 (5.8%) than in 2019 (3.3%). From 2019 to 2022, the percentage of children who had chronic school absenteeism increased for each age group. The percentage of children who had chronic school absenteeism Read More >
Posted on byQuickStats: Percentage of Adults Aged ≥18 Years Who Lacked Reliable Transportation for Daily Living in the Past 12 Months, by Disability Status and Age Group — National Health Interview Survey, United States, 2022
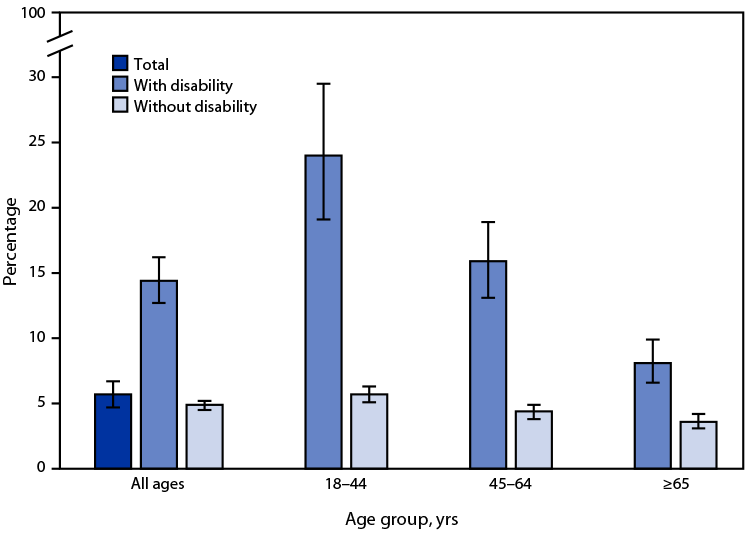
In 2022, 5.7% of adults aged ≥18 years lacked reliable transportation for daily living in the past 12 months. The percentage lacking reliable transportation for daily living among those with disability was higher (14.4%) compared with those without disability (4.9%). The percentages among persons with disability were higher than percentages among those without disability in Read More >
Posted on byQuickStats: Percentage of Newborns Breastfed Between Birth and Discharge from Hospital, by Maternal Age — National Vital Statistics System, 49 States and the District of Columbia, 2021 and 2022
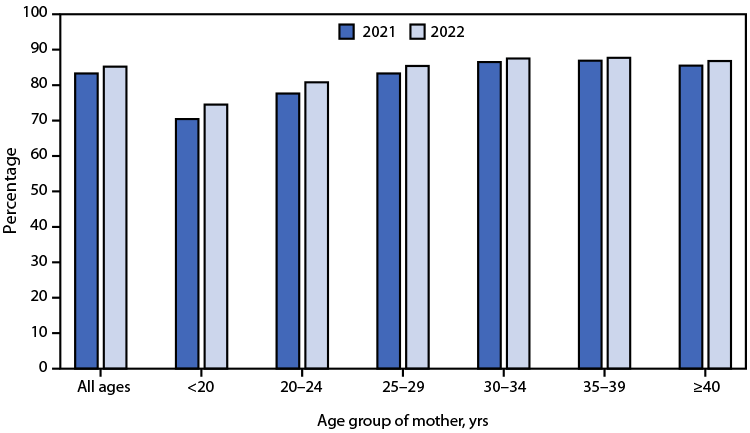
Among 49 states and the District of Columbia, the percentage of newborns breastfed between birth and discharge from the hospital increased from 83.3% in 2021 to 85.2% in 2022. Increases were observed for each maternal age group; the largest increases occurred among younger maternal age groups (70.4% to 74.5% among mothers aged <20 years and Read More >
Posted on byQuickStats: Percentage of Children and Adolescents Aged ≤17 Years Who Visited an Urgent Care Center or a Clinic in a Drug Store or Grocery Store in the Past 12 Months, by Age Group and Year — National Health Interview Survey, United States, 2021–2022
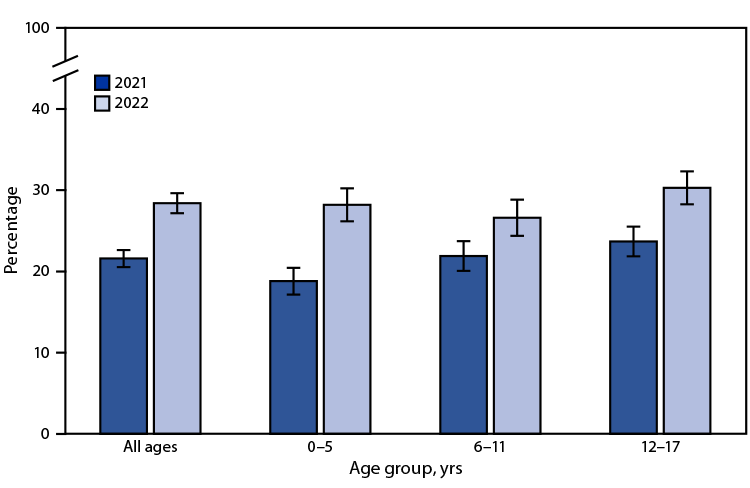
The percentage of children and adolescents aged ≤17 years who had at least one visit to an urgent care center or a clinic in a drug store or grocery store in the past 12 months increased from 21.6% in 2021 to 28.4% in 2022. This increase was noted for all age groups during 2021–2022. In Read More >
Posted on byQuickStats: Percentage of Adults Aged ≥18 Years with Diagnosed Diabetes, by Urbanization Level and Age Group — National Health Interview Survey, United States, 2022
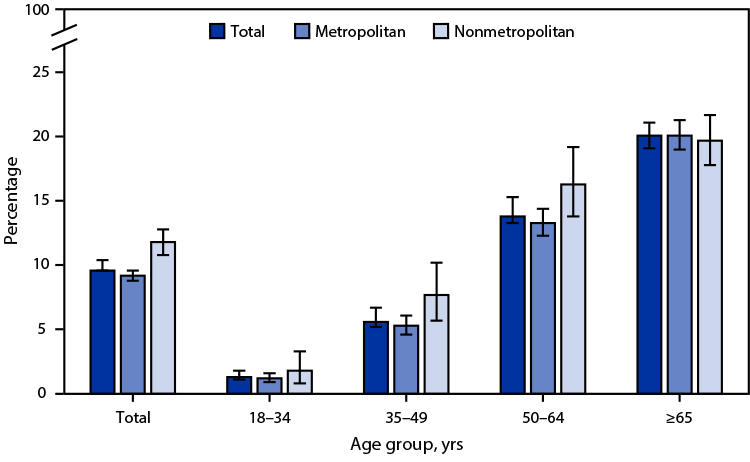
In 2022, 9.6% of adults aged ≥18 years had diagnosed diabetes, with the percentage lower among adults living in metropolitan areas (9.2%) compared with adults in nonmetropolitan areas (11.8%). The prevalence of diagnosed diabetes was lower in metropolitan areas only among those aged 35–49 years (5.3% versus 7.7%) and aged 50–64 years (13.3% versus 16.3%). Read More >
Posted on byQuickStats: Rate of Triplet and Higher-Order Multiple Births by Age of Mother — National Vital Statistics System, United States, 1998 and 2022
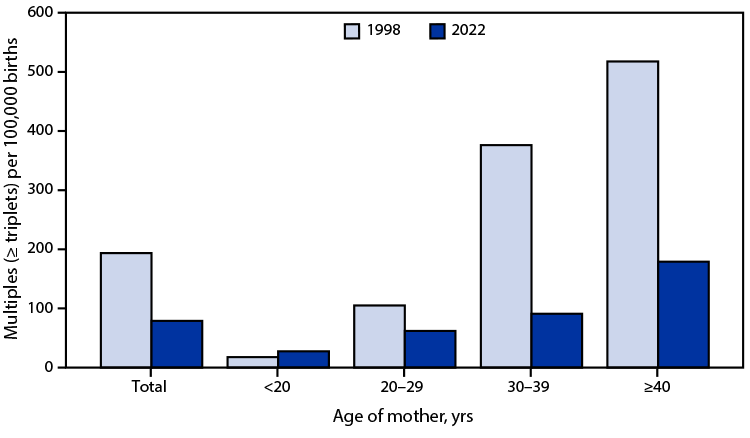
The triplet and higher-order multiple birth rate declined from an all-time high of 193.5 per 100,000 total births in 1998 to 78.9 in 2022. From 1998 to 2022, triplet and higher-order birth rates increased among mothers aged <20 years (from 17.6 to 27.5) but declined among mothers aged ≥20 years. In both 1998 and 2022, Read More >
Posted on byQuickStats: Age-Adjusted Percentage of Adults Aged ≥18 Years Who Received an Influenza Vaccination During the Past 12 Months, by Sex and Race and Ethnicity — National Health Interview Survey, United States, 2022
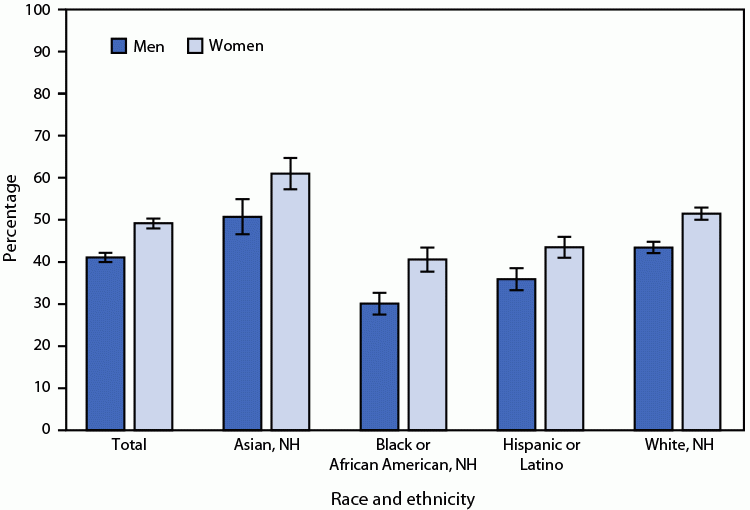
In 2022, among persons aged ≥18 years, women were more likely than were men (49.2% versus 41.1%) to have received an influenza vaccination during the past 12 months. Women were more likely than were men to have received an influenza vaccination among Asian (61.0% versus 50.7%), Black (40.6% versus 30.1%), Hispanic (43.5% versus 35.9%), and Read More >
Posted on byQuickStats: Percentage of Adults Aged ≥18 Years Who Rarely or Never Get the Social and Emotional Support They Need, by Sex and Disability Status — National Health Interview Survey, United States, 2021
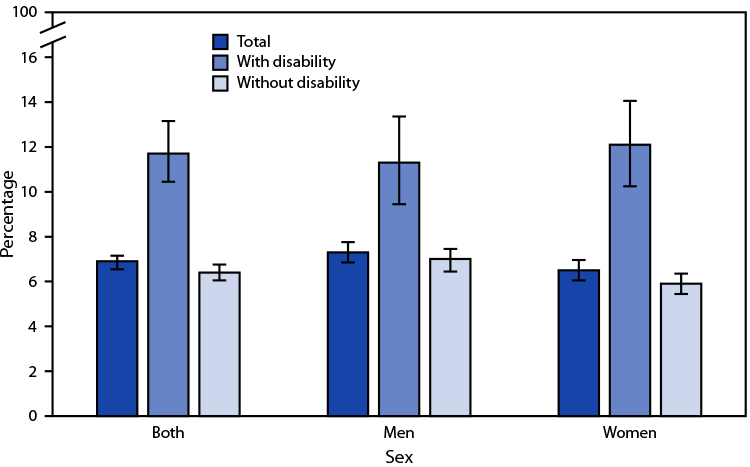
In 2021, 6.9% of adults aged ≥18 years rarely or never got the social and emotional support they needed. Overall, the percentage was higher among those with a disability (11.7%) than among those without disability (6.4%). Among men, 11.3% of those with disability rarely or never got needed support, compared with 7.0% of those without Read More >
Posted on byQuickStats: Percentage of Adults Aged ≥18 Years Who Felt Very Tired or Exhausted Most Days or Every Day in the Past 3 Months, by Sex and Age Group — National Health Interview Survey, United States, 2022
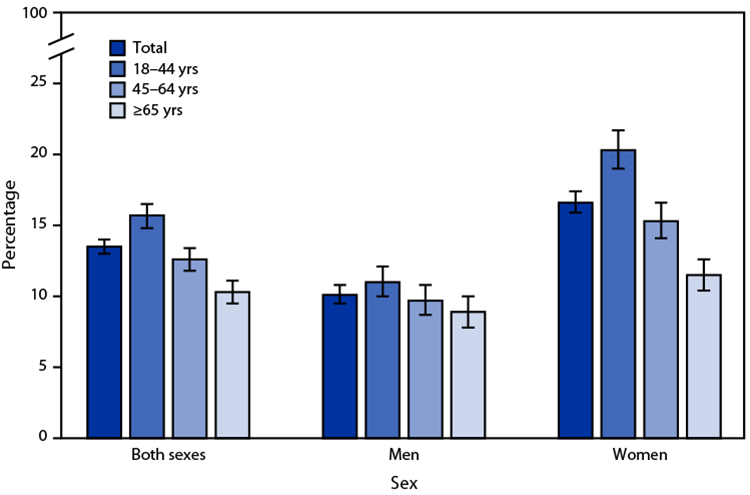
In 2022, 13.5% of adults aged 18 and older felt very tired or exhausted most days or every day in the past 3 months, and this percentage declined with age. Among men, the percentage was highest among those aged 18–44 years (11.0%), followed by those aged 45–64 years (9.7%) and ≥65 years (8.9%). Among women, Read More >
Posted on byQuickStats: Age-Adjusted Death Rates for Stroke, by Region — National Vital Statistics System, United States, 2001–2021
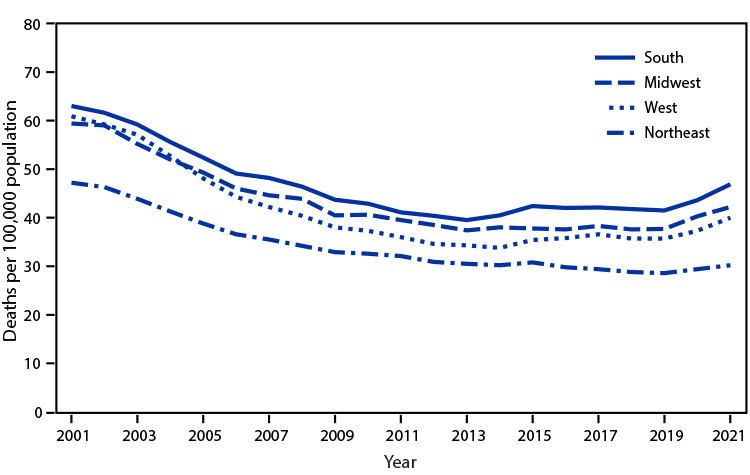
The age-adjusted death rate for stroke declined for all regions from 2001 to 2021. Stroke death rates declined from 2001 through 2013 for persons living in the South (63.0 to 39.5 per 100,000 population) and Midwest (59.4 to 37.4), through 2014 for persons living in the West (60.9 to 33.8), and through 2019 for persons Read More >
Posted on byQuickStats: Sepsis-Related Death Rates Among Persons Aged ≥65 Years, by Age Group and Sex — National Vital Statistics System, United States, 2021
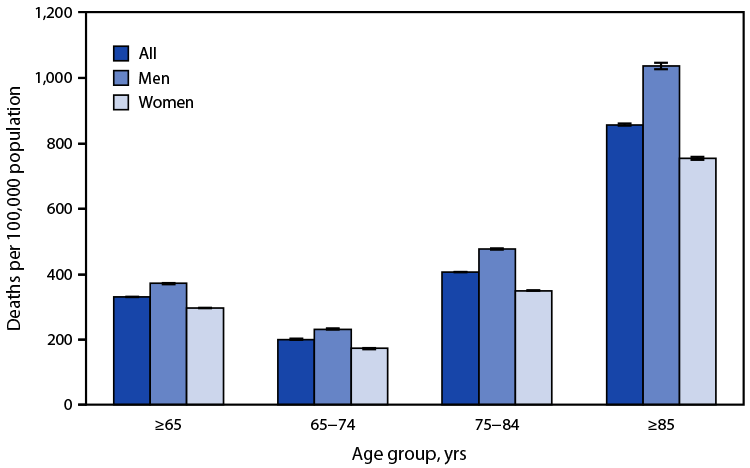
In 2021, the sepsis-related death rate among persons aged ≥65 years was 330.9 deaths per 100,000 population; the rate among men (371.7) was higher than that among women (297.4). Sepsis-related death rates among men were higher than those among women in each age group: 232.7 versus 173.0 (65–74 years), 477.3 versus 349.8 (75–84 years), and Read More >
Posted on byQuickStats: Number of Deaths Resulting from Being Bitten or Struck by a Dog, by Sex — National Vital Statistics System, United States, 2011–2021
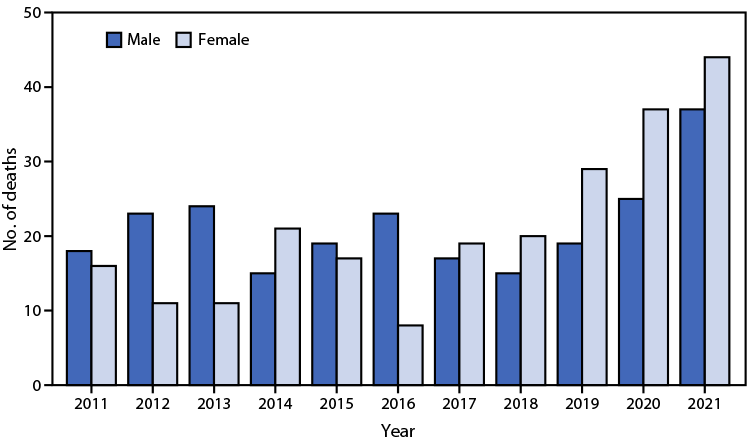
During 2011–2021, a total of 468 deaths from being bitten or struck by a dog occurred (average = 43 deaths per year). The annual number of deaths ranged from 31 (2016) to 81 (2021). During 2011–2016, more deaths occurred among males than among females during most years; however, during 2017–2021, more deaths occurred among females Read More >
Posted on byQuickStats: Age-Adjusted Rates of Death Involving Exposure to Excessive Heat Among States with the Highest Numbers of Deaths — National Vital Statistics System, United States, 2021
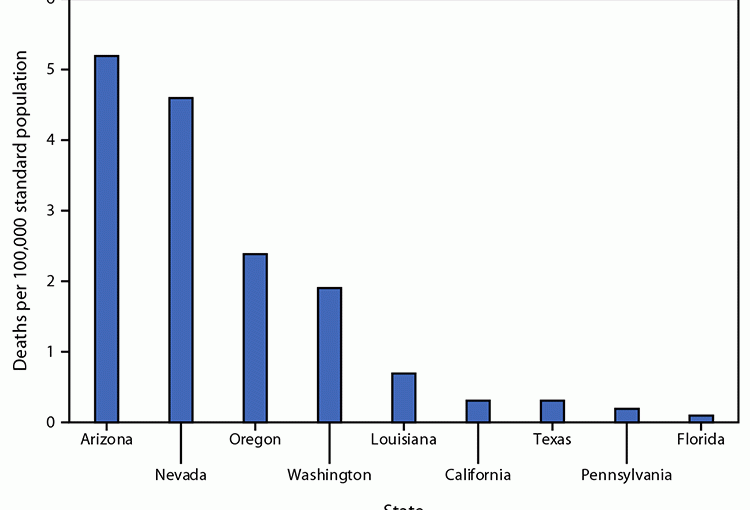
The 2021 age-adjusted heat-related death rate for the United States was 0.4 deaths per 100,000 population. A total of 1,600 deaths were reported, and nine states accounted for >75% (1,226) of those deaths. Arizona recorded 426 deaths and had the highest rate (5.2 per 100,000), followed by Nevada (4.6), Oregon (2.4), Washington (1.9), and Louisiana Read More >
Posted on byQuickStats: Unintentional Drowning Death Rates of Children and Adolescents Aged 0–17 Years, by Sex and Age Group — United States, 2020–2021
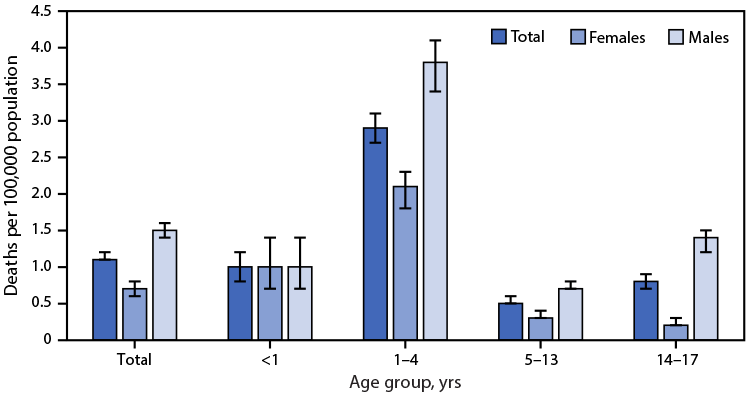
During 2020–2021, the unintentional drowning death rate was 1.1 deaths per 100,000 population among children and adolescents aged 0–17 years. Rates were higher among males (1.5) than females (0.7). Among children aged <1 year, boys and girls had similar unintentional drowning death rates (1.0), whereas rates were higher for males than for females among those Read More >
Posted on byQuickStats: Percentage of Children and Adolescents Aged ≤17 Years Who Had Ever Received a Diagnosis of Concussion or Brain Injury, by Sex and Age Group — National Health Interview Survey, United States, 2022
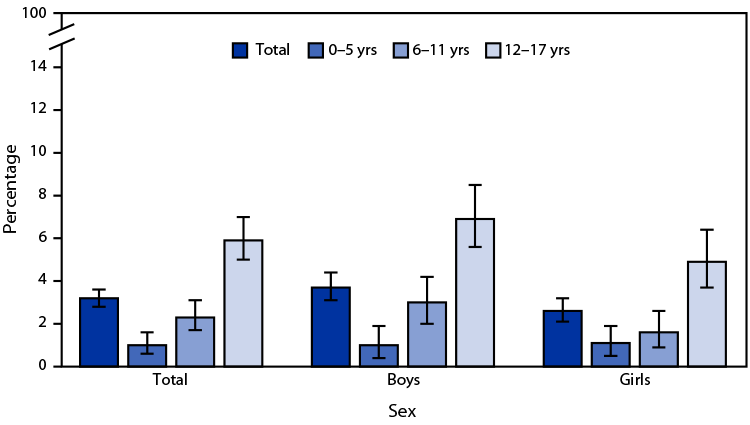
In 2022, 2.3 million (3.2%) children and adolescents aged ≤17 years had ever received a diagnosis of a concussion or brain injury. Diagnosis of a concussion or brain injury increased with age, from 1.0% among those aged 0–5 years to 2.3% among those aged 6–11 years, and 5.9% among those aged 12–17 years. Percentages were Read More >
Posted on byQuickStats: Percentage of Adults Aged ≥18 Years who Received an Influenza Vaccination in the Past 12 Months, by Race and Ethnicity and Family Income — National Health Interview Survey, United States, 2021
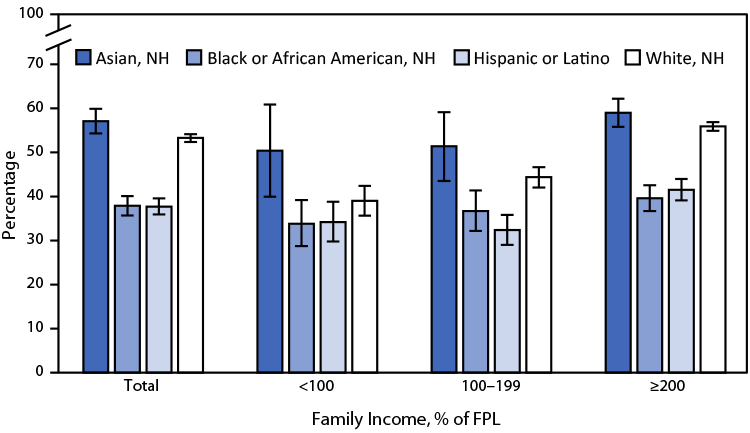
In 2021, non-Hispanic Asian (Asian) adults aged ≥18 years were the most likely to receive an influenza vaccination in the past 12 months (57.1%) followed by non-Hispanic White (White) (53.3%) adults; Hispanic or Latino (Hispanic) and non-Hispanic Black or African American (Black) adults were the least likely to receive an influenza vaccination (37.7% and 37.9%, Read More >
Posted on by
