Category: Influenza
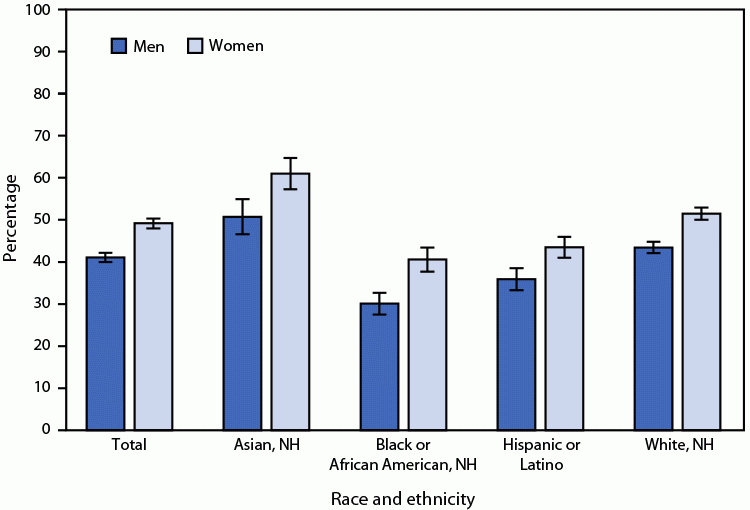
QuickStats: Age-Adjusted Percentage of Adults Aged ≥18 Years Who Received an Influenza Vaccination During the Past 12 Months, by Sex and Race and Ethnicity — National Health Interview Survey, United States, 2022

In 2022, among persons aged ≥18 years, women were more likely than were men (49.2% versus 41.1%) to have received an influenza vaccination during the past 12 months. Women were more likely than were men to have received an influenza vaccination among Asian (61.0% versus 50.7%), Black (40.6% versus 30.1%), Hispanic (43.5% versus 35.9%), and Read More >
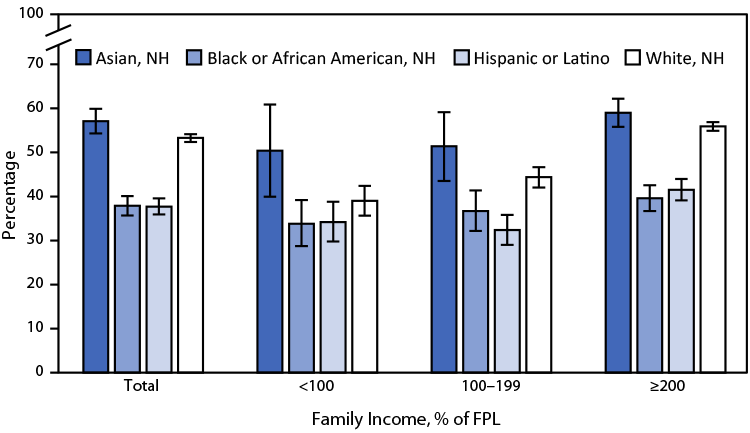
Posted on byQuickStats: Percentage of Adults Aged ≥18 Years who Received an Influenza Vaccination in the Past 12 Months, by Race and Ethnicity and Family Income — National Health Interview Survey, United States, 2021

In 2021, non-Hispanic Asian (Asian) adults aged ≥18 years were the most likely to receive an influenza vaccination in the past 12 months (57.1%) followed by non-Hispanic White (White) (53.3%) adults; Hispanic or Latino (Hispanic) and non-Hispanic Black or African American (Black) adults were the least likely to receive an influenza vaccination (37.7% and 37.9%, Read More >
Posted on byQuickStats: Percentage of Residential Care Communities that Offer Annual Influenza Vaccination to Residents and to Employees and Contract Staff Members, by Community Bed Size — United States, 2020
In 2020, 87.2% of residential care communities offered annual influenza vaccination to residents, and 77.8% offered annual influenza vaccination to all employees and contract staff members. The percentage of residential care communities offering annual influenza vaccination to residents and to all employees and contract staff members increased with increasing community bed size. The percentage of Read More >
Posted on byQuickStats: Percentage of Adults Aged 18 Years or Older Who Received an Influenza Vaccination in the Past 12 Months, by Sex and Age Group — National Health Interview Survey, United States, 2020
During 2020, 43.7% of men and 51.9% of women aged 18 years or older received an influenza vaccination in the past 12 months, and the prevalence increased with age for both sexes. Among men, 32.7% aged 18–44 years, 43.7% aged 45–64 years, and 69.0% aged 65 years or older received an influenza vaccination. Among women, Read More >
Posted on byPODCAST: The 2020 Increase in Death Rates Were The Highest Ever Recorded
STATCAST, JUNE 2021: DISCUSSION WITH FARIDA AHMAD, STATISTICIAN, ABOUT LATEST PROVISIONAL QUARTERLY MORTALITY DATA. https://www.cdc.gov/nchs/pressroom/podcasts/2021/20210611/20210611.htm HOST: Each quarter NCHS releases provisional data on mortality from leading causes of death in the U.S. on an interactive web-based dashboard. This week the dashboard was updated to include Quarter 4 data from 2020 and gives a complete account of provisional Read More >
Posted on byInfluenza Vaccination in the Past 12 Months Among Children Aged 6 Months–17 Years: United States, 2019
Questions for Lindsey Black, Health Statistician and Lead Author of “Influenza Vaccination in the Past 12 Months Among Children Aged 6 Months–17 Years: United States, 2019.” Q: Is this the most recent data you have on this topic? If so, when will you release 2020 vaccination data? LB: Yes, this is the most recent data. Read More >
Posted on byNCHS UPDATES”STATS OF THE STATES” PAGE WITH LATEST FINAL DATA
The CDC National Center for Health Statistics web page “Stats of the States” has been updated to include the latest state-based final data on selected vital statistics topics, including: General fertility rates Teen birth rates Selected other maternal and infant health measures Marriage & divorce rates Leading causes of death Other high profile causes of Read More >
Posted on byQuickStats: Age-Adjusted Death Rates for Influenza and Pneumonia, by Urbanization Level and Sex — National Vital Statistics System, United States, 2019
In 2019, age-adjusted death rates for influenza and pneumonia were higher among males (14.4 per 100,000) than females (10.7) and among those who lived in rural counties (15.3) compared with those who lived in urban counties (11.7). Among males, the age-adjusted death rate for influenza and pneumonia was 17.4 in rural counties and 13.9 in Read More >
Posted on byQuickStats: Percentage of Emergency Department (ED) Visits Made by Adults with Influenza and Pneumonia That Resulted in Hospital Admission, by Age Group
During 2017–2018, 37.2% of ED visits for influenza and pneumonia by adults aged 18 years or older resulted in a hospital admission. The percentage increased with age from 14.4% for adults aged 18–54 years to 46.9% for adults aged 55–74 years and 69.7% for adults aged 75 years or older. Source: National Center for Health Statistics. Read More >
Posted on byFact or Fiction – Are Flu and pneumonia are responsible for 57,000 deaths in the United States each year?
http://www.youtube.com/watch?v=4LLLgfCUlFI Source: National Vital Statistics System, 1999-2018 https://wonder.cdc.gov Read More >
Posted on by2017 Final Deaths, Leading Causes of Death and Life Tables Reports Released
NCHS released a report that presents the final 2017 data on U.S. deaths, death rates, life expectancy, infant mortality, and trends, by selected characteristics such as age, sex, Hispanic origin and race, state of residence, and cause of death. Key Findings: In 2017, a total of 2,813,503 deaths were reported in the United States. The Read More >
Posted on byQuickStats: Percentage of Adults Aged 18–64 Years Who Had an Influenza Vaccination† in the Past 12 Months, by Sex and Current Asthma Status
In 2017, adults aged 18–64 years with current asthma were more likely to have had an influenza vaccination in the past 12 months (47.9%) than those without asthma (36.4%). Regardless of asthma status, women were more likely than men to have had an influenza vaccination in the past 12 months. Women aged 18–64 years with Read More >
Posted on byQuickStats: Age-Adjusted Percentage of Adults Aged 65 Years or Older Who Had an Influenza Vaccine in the Past 12 Months, by Poverty Status — National Health Interview Survey, United States, 1999–2001 and 2014–2016
During 2014–2016, 69.2% of all older adults, aged 65 years or older, had received an influenza vaccine in the past 12 months. The percentage of older adults with family income ≥200% poverty level who had received an influenza vaccine in the past 12 months significantly increased from 67.9% during 1999–2001 to 72.2% during 2014–2016. During Read More >
Posted on byStat of the Day – December 5, 2017
#STATOFTHEDAY Percentage of U.S. adults aged 18-49 that received an #influenza #vaccination during the past year increased from 30.5% in first quarter of 2016 to 34.7% in first quarter of 2017 https://t.co/7ckmC6Knzk #influenzavaccinationweek — NCHS (@NCHStats) December 5, 2017 Read More >
Posted on byQuickStats: Number of Deaths from 10 Leading Causes by Sex — National Vital Statistics System, United States, 2015
In 2015, a total of 1,339,226 deaths among females and 1,373,404 deaths among males occurred. Heart disease and cancer were the top two causes of death for both females and males; other leading causes varied in rank by sex. The 10 leading causes of death accounted for approximately three-quarters of all deaths. Source: https://www.cdc.gov/mmwr/volumes/66/wr/mm6615a8.htm Read More >
Posted on byState by State Health Data Source Updated on NCHS Web Site
CDC’s National Center for Health Statistics has updated its “Stats of the States” feature on the NCHS web site. This resource features the latest state-by-state comparisons on key health indicators ranging from birth topics such as teen births and cesarean deliveries to leading causes of death and health insurance coverage. Tabs have been added to Read More >
Posted on byVaccination Coverage Among Adults With Diagnosed Diabetes: United States, 2015
Questions for Maria A. Villarroel, Ph.D., Health Statistician and Lead Author on “Vaccination Coverage Among Adults With Diagnosed Diabetes: United States, 2015.” Q: Why did you decide to look at vaccination coverage with diagnosed diabetes? MV: Persons with diabetes are at an increased risk for complications from vaccine-preventable infections, and a number of these of Read More >
Posted on byInfluenza Vaccine Stats
With winter now in full force, it is important for people to get vaccinated against influenza, a serious respiratory disease that can lead to hospitalization and sometimes even death. Every flu season is different, and influenza infection can affect people differently. An annual seasonal flu vaccine (either through a shot or nasal mist) is the best way to Read More >
Posted on byHow’s your state doing?
NCHS now has an easy way for you to check out where your state stands on a variety of health measures compared with the nation as a whole and other states, including the following: Mortality from leading causes of death Birth data, including births to unmarried mothers, teen births, cesarean deliveries, low birthweight births, prenatal Read More >
Posted on by 2 CommentsHow does your state fare when it comes to death rates from flu and pneumonia?
Age-adjusted death rates shown here are deaths per 100,000 population. To learn more, visit www.cdc.gov/nchs/deaths.htm. Read More >
Posted on byData on deaths due to influenza
The National Center for Health Statistics keeps track of mortality (death) across the United States. This includes tracking deaths from the eighth leading cause of death, Influenza and Pneumonia. The most recent findings (2006) are as follows: Number of deaths from Influenza and Pneumonia, 2006: 56,326 Age-adjusted death rate for Influenza and Pneumonia (deaths per 100,000 Read More >
Posted on by 1 Comment
