Category: NHANES
CDC Extends Tool to Monitor Severe Obesity Among Children and Adolescents
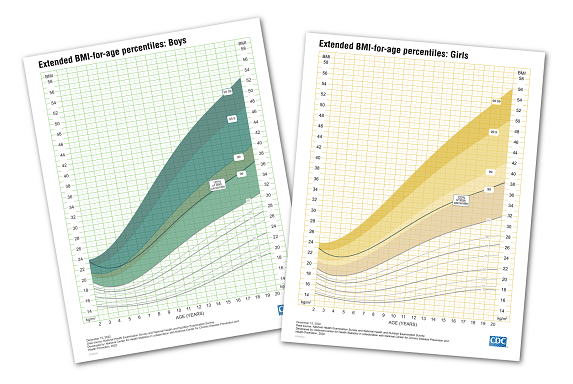
CDC has added to its BMI-for-age growth charts to enable consistent, meaningful tracking of growth in the nearly one in five U.S. children and adolescents who have obesity. The percentage of children and adolescents with severe obesity has nearly quadrupled over the last five decades, from 1% in the early 1970s to 6.1% in 2017-18. Read More >
Posted on byAsk the Expert: Dr. Kirsten Herrick

The NHANES National Youth Fitness Survey (NNYFS) was developed as a model of comprehensive, youth-targeted fitness and nutrition data collection. As a standalone survey conducted alongside the National Health and Nutrition Examination Survey (NHANES), NNYFS collected data on exercise and nutrition habits of U.S. children aged 3 to 15, through interviews and fitness tests conducted in a Read More >
Posted on byDirector’s Corner—New Year, New Challenges, New Opportunities

Every year brings its own set of challenges, opportunities, and successes, and 2013 was certainly no exception. Over the course of the year, a number of long-term leaders chose to retire. Center Director Dr. Edward Sondik; Stephanie Ventura, Chief of the Reproductive Statistics Branch; Marjorie Greenberg, Chief of the Classifications and Public Health Data Standards Read More >
Posted on byNew Survey Measures the Fitness of America’s Youth
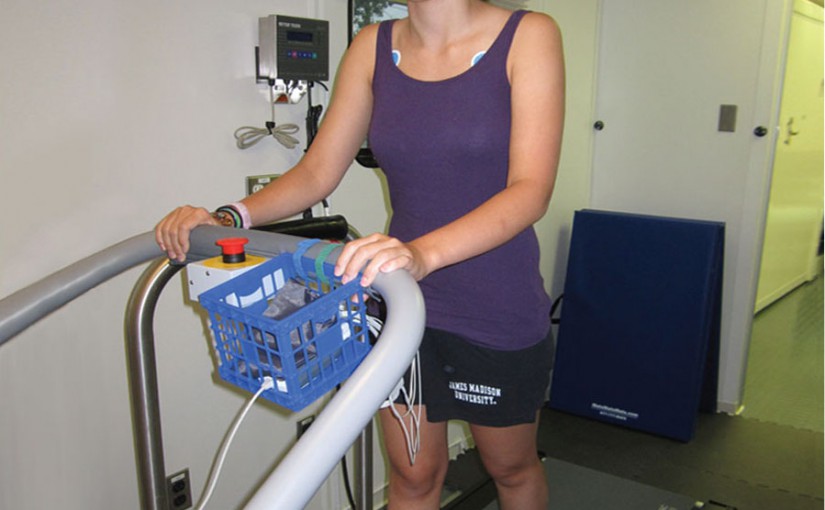
The NHANES National Youth Fitness Survey (NYFS), conducted as a separate survey alongside the National Health and Nutrition Examination Survey (NHANES), is receiving an enthusiastic response from its young participants. For the NYFS team in the Division of Health and Nutrition Examination Surveys, attaining good response rates is critical to the program’s success. The NYFS, funded Read More >
Posted on byOne in seven adults don’t know they have certain major chronic conditions
Findings from a new report, “Hypertension, High cholesterol, and Diabetes: Racial and Ethnic Prevalence Differences in US Adults, 1999-2006” were presented at last month’s National Health and Nutrition Examination Survey (NHANES) tour for members of the Association of Health Care Journalists in Chicago, IL. NHANES is a program of studies designed to assess the health Read More >
Posted on by 1 Comment