Category: diabetes
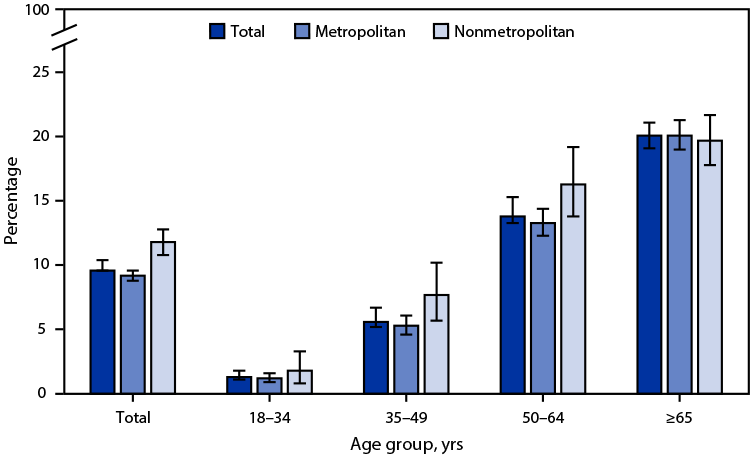
QuickStats: Percentage of Adults Aged ≥18 Years with Diagnosed Diabetes, by Urbanization Level and Age Group — National Health Interview Survey, United States, 2022

In 2022, 9.6% of adults aged ≥18 years had diagnosed diabetes, with the percentage lower among adults living in metropolitan areas (9.2%) compared with adults in nonmetropolitan areas (11.8%). The prevalence of diagnosed diabetes was lower in metropolitan areas only among those aged 35–49 years (5.3% versus 7.7%) and aged 50–64 years (13.3% versus 16.3%). Read More >
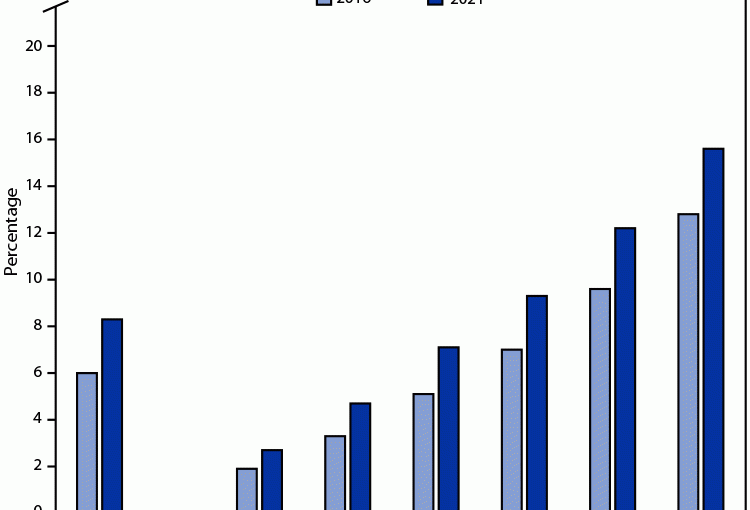
Posted on byQuickStats: Percentage of Mothers with Gestational Diabetes, by Maternal Age — National Vital Statistics System, United States, 2016 and 2021

The percentage of mothers giving birth who received a diagnosis of diabetes during pregnancy (gestational diabetes) increased from 6.0% in 2016 to 8.3% in 2021. Increases in gestational diabetes were seen in each maternal age group, and rates rose steadily with maternal age; in 2021, the rate for mothers aged ≥40 years (15.6%) was nearly Read More >
Posted on byQuickStats: Percentage of Adults Aged ≥18 Years with Diagnosed Diabetes, by Disability Status and Age Group — National Health Interview Survey, United States, 2020
In 2020, 25.7% of adults aged ≥18 years with disability had diagnosed diabetes compared with 7.7% of those without disability. For each age group, those with disability were more likely to have diabetes: adults aged 18–44 years (8.3% versus 2.2%), 45–64 years (25.3% versus 9.9%), and ≥65 years (34.2% versus 17.8%). Regardless of disability status, Read More >
Posted on byQuickStats: Percentage of Adults Aged 18 or Older with Diagnosed Diabetes by Urbanization Level and Age Group
In 2019, the percentage of adults aged 18 years or older with diagnosed diabetes was higher among those living in nonmetropolitan areas (12.4%) than among those living in metropolitan areas (8.9%). Percentages of adults with diagnosed diabetes were higher in nonmetropolitan than metropolitan areas for those aged 18–44 years (3.5% versus 2.3%) and 45–64 years Read More >
Posted on byHealth of American Indian and Alaska Native Adults, by Urbanization Level: United States, 2014–2018
Questions for Maria Villarroel, Health Statistician and Lead Author of “Health of American Indian and Alaska Native Adults, by Urbanization Level: United States, 2014–2018.” Q: Why did you decide to do a report on health in American Indian and Alaska Native (AIAN) adults? MV: There is limited information about the health of the American Indian Read More >
Posted on byQuickStats: Percentage of Adults Aged 18 Years or Older with Disability by Diagnosed Diabetes Status and Age Group
In 2018, among adults aged 18 years or older, those ever receiving a diagnosis of diabetes were more likely to have disability than those never receiving a diagnosis of diabetes (27.1% versus 8.1%). This pattern was consistent among adults aged 18–44 (16.3% versus 4.4%), 45–64 (24.5% versus 8.1%), and 65 years or older (33.3% versus Read More >
Posted on byStrategies Used by Adults With Diagnosed Diabetes to Reduce Their Prescription Drug Costs, 2017–2018
Questions for Robin Cohen, Ph.D. and Lead Author of ”Strategies Used by Adults with Diagnosed Diabetes to Reduce Their Prescription Drug Costs, 2017-2018.” Q: What do you think is the most significant finding in your report? RC: Among adults with diagnosed diabetes, more than 13 percent did not take their medication as prescribed to save Read More >
Posted on byEye Disorders and Vision Loss among U.S. Adults Aged 45 and Over with Diagnosed Diabetes
Questions for Lead Author Amy Cha, Statistician, of “Eye Disorders and Vision Loss among U.S. Adults Aged 45 and Over with Diagnosed Diabetes.” Q: Why did you decide to focus on eye disorder and vision loss for adults aged 45 or older with diagnosed diabetes for this report? AC: The prevalence of diabetes increases with Read More >
Posted on by2017 Final Deaths, Leading Causes of Death and Life Tables Reports Released
NCHS released a report that presents the final 2017 data on U.S. deaths, death rates, life expectancy, infant mortality, and trends, by selected characteristics such as age, sex, Hispanic origin and race, state of residence, and cause of death. Key Findings: In 2017, a total of 2,813,503 deaths were reported in the United States. The Read More >
Posted on byQuickStats: Death Rates from Diabetes Mellitus as Underlying or Contributing Cause Among Adults Aged 65 Years or Older, by Race/Ethnicity
During 2004–2017, the death rate from diabetes mellitus as underlying or contributing cause among adults aged 65 years or older decreased from 477.5 per 100,000 in 2004 to 418.1 in 2017. Throughout this period, the death rate was highest among non-Hispanic black adults and lowest among non-Hispanic white adults. During 2004–2017, the death rate decreased Read More >
Posted on byQuickStats: Age-Adjusted Percentage of Adults Aged 18 Years or Older Reporting Diabetic Retinopathy Among Those with Prediabetes or Diagnosed Diabetes by Age Group
During 2016–2017, adults aged 18–64 years with type 1 diabetes were more likely to have ever had diabetic retinopathy than adults with type 2 diabetes (23.8% compared with 5%). Adults aged 65 years or older with type 1 diabetes were also more likely to have ever had diabetic retinopathy than adults with type 2 diabetes Read More >
Posted on byEarly Release of Selected Estimates Based on Data From January-June 2018 National Health Interview Survey
Questions for Lead Author Tainya C. Clarke, Ph.D., M.P.H., Health Statistician, of “Early Release of Selected Estimates Based on Data From January-June 2018 National Health Interview Survey.” Q: What are some of the findings that you would highlight in this early release report? TC: Diabetes and obesity continue to increase among U.S. adults. The prevalence Read More >
Posted on byFact or Fiction: Is Undiagnosed diabetes more prevalent among American adults than diabetes that has already been diagnosed by a physician?
http://www.youtube.com/watch?v=_quQ-uQWav4 Source: National Health and Nutrition Examination Survey, 2013-2016 https://www.cdc.gov/nchs/data/databriefs/db319.pdf Read More >
Posted on byPrevalence of Total, Diagnosed, and Undiagnosed Diabetes Among Adults: United States, 2013-2016
Questions for Mark Eberhardt, Health Statistician and Lead Author of “Prevalence of Total, Diagnosed, and Undiagnosed Diabetes Among Adults: United States, 2013-2016” Q: Why did you decide to focus on diabetes in the United States for this report? ME: The National Health and Nutrition Examination Survey (NHANES) is the only nationally representative survey that can Read More >
Posted on byQuickStats: Percentage of Visits to Office-Based Physicians by Adults Aged 18 Years or Older for Diabetes Mellitus, by Sex and Age — National Ambulatory Medical Care Survey, 2015
In 2015, diabetes was a reason for 4.2% of visits by adults to office-based physicians. Men aged 18–44 years had a higher percentage of visits for diabetes compared with women aged 18–44 years (2.2% versus 0.4%, respectively). Both women and men aged 18–44 years had a lower percentage of visits for diabetes compared with adults Read More >
Posted on byStat of the Day – November 14, 2017
#STATOFTHEDAY In 2011–2014, approximately 1 in 9 adults in the United States had diabetes https://t.co/wC1dWDgnBY #AmericanDiabetesMonth — NCHS (@NCHStats) November 14, 2017 Read More >
Posted on byStat of the Day – November 2, 2017
#STATOFTHEDAY 10.5% of US adults have been diagnosed with #diabetes, Jan-March 2017 estimate https://t.co/2uXO80eELr #AmericanDiabetesMonth — NCHS (@NCHStats) November 2, 2017 Read More >
Posted on byQuickStats: Percentage of Adults Aged 65 Years or Older Who Saw Selected Types of Health Professionals in the Past 12 Months, by Diagnosed Diabetes Status
In 2015, adults aged 65 years or older with diagnosed diabetes were more likely than adults without diagnosed diabetes to report seeing general doctors (92.3% compared with 86.7%); eye doctors (66.9% compared with 56.6%); physician specialists (51.5% compared with 45.5%); foot doctors (29.9% compared with 13.0%) and mental health professionals (6.3% compared with 4.5%) in Read More >
Posted on byQuickStats: Number of Deaths from 10 Leading Causes by Sex — National Vital Statistics System, United States, 2015
In 2015, a total of 1,339,226 deaths among females and 1,373,404 deaths among males occurred. Heart disease and cancer were the top two causes of death for both females and males; other leading causes varied in rank by sex. The 10 leading causes of death accounted for approximately three-quarters of all deaths. Source: https://www.cdc.gov/mmwr/volumes/66/wr/mm6615a8.htm Read More >
Posted on byState by State Health Data Source Updated on NCHS Web Site
CDC’s National Center for Health Statistics has updated its “Stats of the States” feature on the NCHS web site. This resource features the latest state-by-state comparisons on key health indicators ranging from birth topics such as teen births and cesarean deliveries to leading causes of death and health insurance coverage. Tabs have been added to Read More >
Posted on byEarly Release of Selected Estimates Based on Data From the January–September 2016 National Health Interview Survey
Questions for Tainya C. Clarke, Ph.D., M.P.H., Health Statistician and Lead Author on the “Early Release of Selected Estimates Based on Data From the January–September 2016 National Health Interview Survey.” Q: What health measures does this report look at? TC: The measures covered in this report are lack of health insurance coverage and type of Read More >
Posted on byVaccination Coverage Among Adults With Diagnosed Diabetes: United States, 2015
Questions for Maria A. Villarroel, Ph.D., Health Statistician and Lead Author on “Vaccination Coverage Among Adults With Diagnosed Diabetes: United States, 2015.” Q: Why did you decide to look at vaccination coverage with diagnosed diabetes? MV: Persons with diabetes are at an increased risk for complications from vaccine-preventable infections, and a number of these of Read More >
Posted on byAny Visit to the Eye Doctor in the Past 12 Months Among Adults Diagnosed With Diabetes, by Years Since Diabetes Diagnosis and by Age: United States, 2012-2013
Increasing time since diabetes diagnosis is strongly associated with severe vision loss. A comprehensive eye examination by an optometrist or ophthalmologist at least annually or biannually is recommended for persons with diabetes, to identify changes in the blood vessels of the retina. The effectiveness of treatment is well established, warranting screening for diabetic retinopathy and Read More >
Posted on byHealth Care Utilization Among U.S. Adults With Diagnosed Diabetes, 2013
Diabetes is a chronic medical condition that affects 1 in 10 adults in the United States. Diabetes can affect multiple organs and lead to serious health complications. Ongoing medical care is recommended for persons of any age who have diabetes in order to manage levels of glucose, obtain preventive care services, and treat diabetes-related complications. Read More >
Posted on byRacial Differences in Life Expectancy
The trend in U.S. life expectancy since 1900 has been gradually improving. In 2010, life expectancy at birth was 78.7 years, an increase of 11% since 1970. For the white population, life expectancy increased 10%, and for the black population the increase was 17%. Nevertheless, differences in life expectancy by race have been observed and Read More >
Posted on by 1 Comment
