CDC Extends Tool to Monitor Severe Obesity Among Children and Adolescents
Posted on by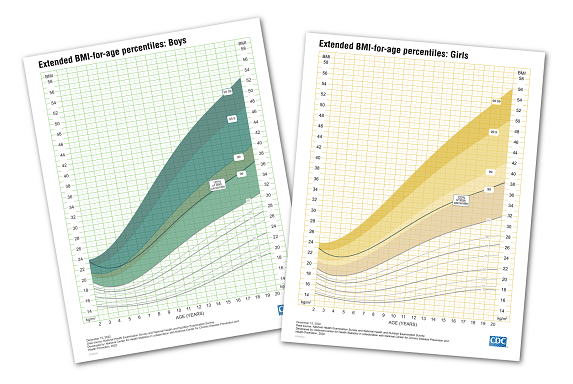 CDC has added to its BMI-for-age growth charts to enable consistent, meaningful tracking of growth in the nearly one in five U.S. children and adolescents who have obesity. The percentage of children and adolescents with severe obesity has nearly quadrupled over the last five decades, from 1% in the early 1970s to 6.1% in 2017-18. Because of this, CDC has extended its charts to a BMI of 60 and included additional percentiles. These extended charts with additional percentiles have been published in a new report from CDC’s National Center for Health Statistics (NCHS).
Data from NCHS’s National Health and Nutrition Examination Survey (NHANES) show that 4.5 million children and adolescents have severe obesity. These children are at increased risk for health conditions such as type II diabetes and high blood pressure, and at increased risk for depression and low self-esteem.
CDC’s BMI-for-age growth charts, released in 2000, are the most widely used tool to track growth and development in children and to assist in signaling potential developmental problems. The charts help clinicians to define obesity and monitor growth in children and adolescents. They consist of a series of curves called “percentiles” that illustrate children’s growth from age 2 to 19.
Prior to today’s release, the growth charts did not extend high enough to plot very high BMIs for the increasing number of children with severe obesity. The colored shading in the 2022 Extended BMI-for-Age Growth Charts provides a printable visual aid for clinicians when discussing very high BMI and needed care with families.
The new report compares and evaluates different methods for adding curves to the BMI-for-age growth charts to help clinicians and researchers better monitor growth in children and adolescents with very high BMI. The report provides additional details on the method ultimately used to extend the growth charts.
CDC growth charts with BMI percentile curves below the 95th percentile – the cutoff for obesity – remain available for monitoring growth among children without obesity.
The report, charts and corresponding data will be available at www.cdc.gov/growthcharts.
Posted on by