Category: stroke
QuickStats: Age-Adjusted Death Rates for Stroke Among Adults Aged ≥ 65 Years, by Region and Metropolitan Status — National Vital Statistics System, United States, 2020
In 2020, the age-adjusted death rate for stroke among adults aged ≥65 years was 260.5 deaths per 100,000 population with rates lower in metropolitan compared with nonmetropolitan areas (259.4 versus 265.5). The rate was highest among those living in the South (288.2) and lowest among those living in the Northeast (199.1). In the Northeast, the Read More >
Posted on byQuickStats: Age-Adjusted Death Rates from Stroke Among Adults Aged ≥65 Years, by Race and Hispanic Origin — National Vital Statistics System, United States, 2000–2020
Age-adjusted death rates from stroke among adults aged ≥65 years generally declined from 425.9 deaths per 100,000 standard population in 2000 to 250.0 in 2019 before increasing to 260.5 in 2020. During 2019–2020, stroke death rates increased for Hispanic adults (from 221.6 to 234.0), non-Hispanic Asian or Pacific Islander adults (from 203.9 to 216.4), non-Hispanic Read More >
Posted on byNCHS UPDATES”STATS OF THE STATES” PAGE WITH LATEST FINAL DATA
The CDC National Center for Health Statistics web page “Stats of the States” has been updated to include the latest state-based final data on selected vital statistics topics, including: General fertility rates Teen birth rates Selected other maternal and infant health measures Marriage & divorce rates Leading causes of death Other high profile causes of Read More >
Posted on byNational Hospital Care Survey Demonstration Projects: Stroke Inpatient Hospitalizations
Questions for Lead Author Geoffrey Jackson, Health Statistician, of “National Hospital Care Survey Demonstration Projects: Stroke Inpatient Hospitalizations.” Q: What was your objective in conducting this study? GC: The objective of this study is to demonstrate the analytic potential of the National Hospital Care Survey (NHCS) by examining inpatient and emergency department hospital encounters due Read More >
Posted on by2017 Final Deaths, Leading Causes of Death and Life Tables Reports Released
NCHS released a report that presents the final 2017 data on U.S. deaths, death rates, life expectancy, infant mortality, and trends, by selected characteristics such as age, sex, Hispanic origin and race, state of residence, and cause of death. Key Findings: In 2017, a total of 2,813,503 deaths were reported in the United States. The Read More >
Posted on byStat of the Day – May 3, 2017
#STATOFTHEDAY In 2015, #Mississippi had the high stroke death rate in US; #NewYork had lowest https://t.co/TrHO6TRLym #StrokeAwarenessMonth — NCHS (@NCHStats) May 3, 2017 Read More >
Posted on byQuickStats: Number of Deaths from 10 Leading Causes by Sex — National Vital Statistics System, United States, 2015
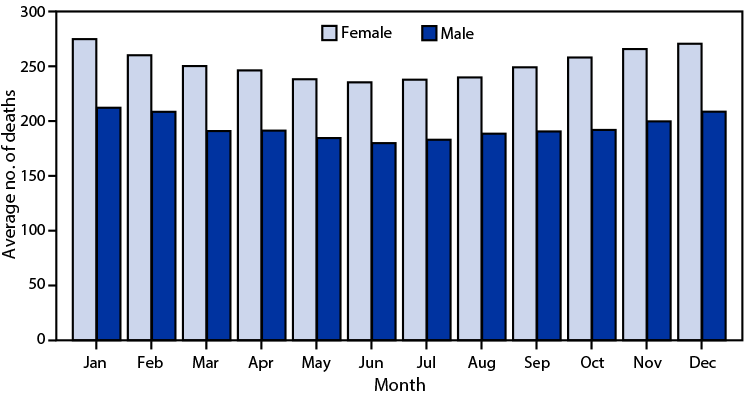
In 2015, a total of 1,339,226 deaths among females and 1,373,404 deaths among males occurred. Heart disease and cancer were the top two causes of death for both females and males; other leading causes varied in rank by sex. The 10 leading causes of death accounted for approximately three-quarters of all deaths. Source: https://www.cdc.gov/mmwr/volumes/66/wr/mm6615a8.htm Read More >
Posted on byState by State Health Data Source Updated on NCHS Web Site
CDC’s National Center for Health Statistics has updated its “Stats of the States” feature on the NCHS web site. This resource features the latest state-by-state comparisons on key health indicators ranging from birth topics such as teen births and cesarean deliveries to leading causes of death and health insurance coverage. Tabs have been added to Read More >
Posted on byDifferences in Stroke Mortality Among Adults Aged 45 and Over: United States, 2010–2013
Despite steady decreases in U.S. stroke mortality over the past several decades, stroke remained the fourth leading cause of death during 2010–2012 and the fifth leading cause in 2013. Most studies have focused on the excess mortality experienced by black persons compared with white persons and by residents of the southeastern states, referred to as Read More >
Posted on byQuickStats: Age–Adjusted Death Rates for Stroke by U.S. Census Region — United States, 1970–2013
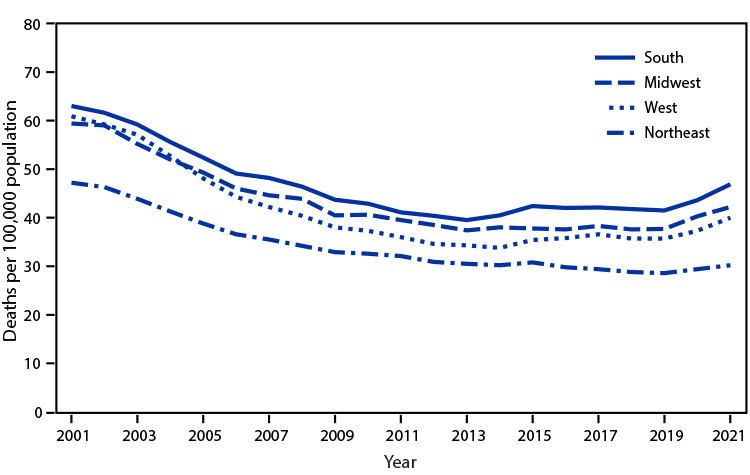
The age-adjusted death rates for stroke in all U.S. Census regions in the United States generally decreased from 1970 to 2013, although the rates in all regions were relatively stable from 1992 to 1999. From 1970 to 2013, the rate decreased an average of 3.3% per year in the South, 3.2% in the Midwest, 3.3% in Read More >
Posted on by