Category: race/ethnicity
U.S. Fertility Rate Drops to Another Historic Low
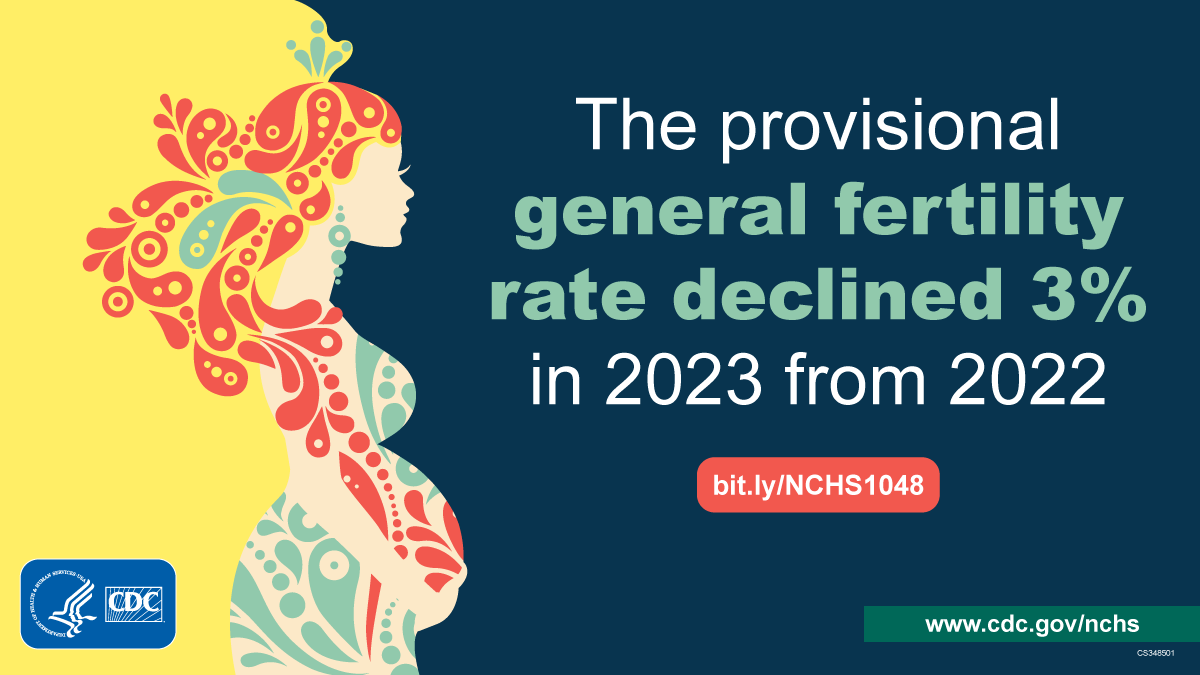
The general fertility rate in the United States decreased by 3% from 2022, reaching a historic low. This marks the second consecutive year of decline, following a brief 1% increase from 2020 to 2021. From 2014 to 2020, the rate consistently decreased by 2% annually. These statistics and others from provisional 2023 birth data were Read More >
Posted on byBeyond the Checkbox: New Standards for Health Data
Accurate data on race and ethnicity are essential for understanding the health of different populations. This information helps support public health programs and research. On March 28, 2024, the Office of Management and Budget (OMB) changed the way NCHS and other statistical agencies will be collecting data on race and ethnicity. OMB is responsible for Read More >
Posted on byQuickStats: Age-Adjusted Percentage of Adults Aged ≥18 Years Who Received an Influenza Vaccination During the Past 12 Months, by Sex and Race and Ethnicity — National Health Interview Survey, United States, 2022
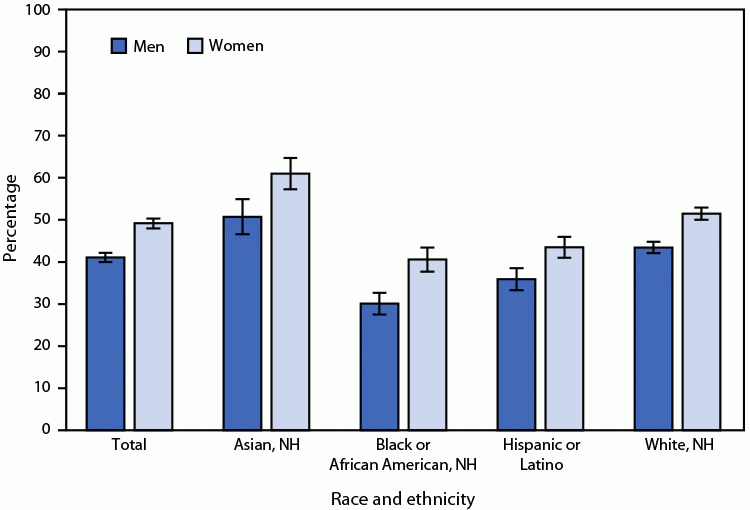
In 2022, among persons aged ≥18 years, women were more likely than were men (49.2% versus 41.1%) to have received an influenza vaccination during the past 12 months. Women were more likely than were men to have received an influenza vaccination among Asian (61.0% versus 50.7%), Black (40.6% versus 30.1%), Hispanic (43.5% versus 35.9%), and Read More >
Posted on byQuickStats: Age-Adjusted Rates of Firearm-Related Homicide, by Race, Hispanic Origin, and Sex — National Vital Statistics System, United States, 2021
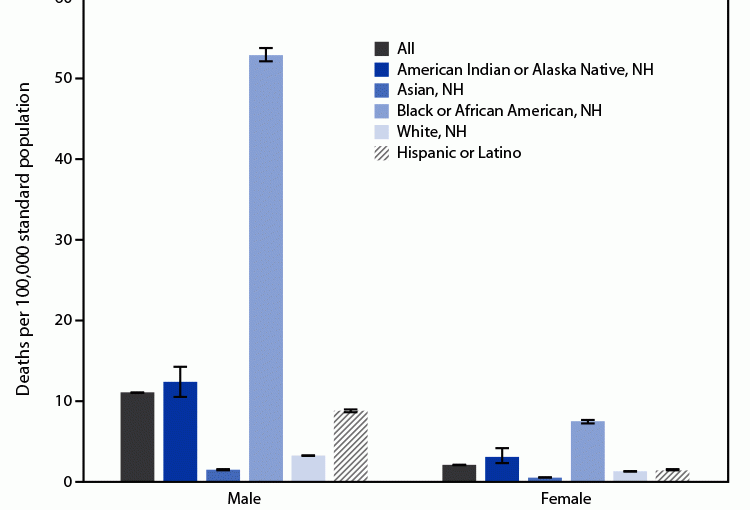
In 2021, among males, Black or African American (Black) males had the highest age-adjusted rate of firearm-related homicide (52.9 deaths per 100,000 standard population), and Asian males had the lowest rate (1.5). Among females, Black females had the highest rate (7.5), and Asian females had the lowest rate (0.5). Males had higher rates than females Read More >
Posted on byQuickStats: Age-Adjusted Percentage of Adults Aged ≥18 Years Who Take Prescription Medication for Depression, by Sex and Race and Hispanic Origin — National Health Interview Survey, United States, 2021
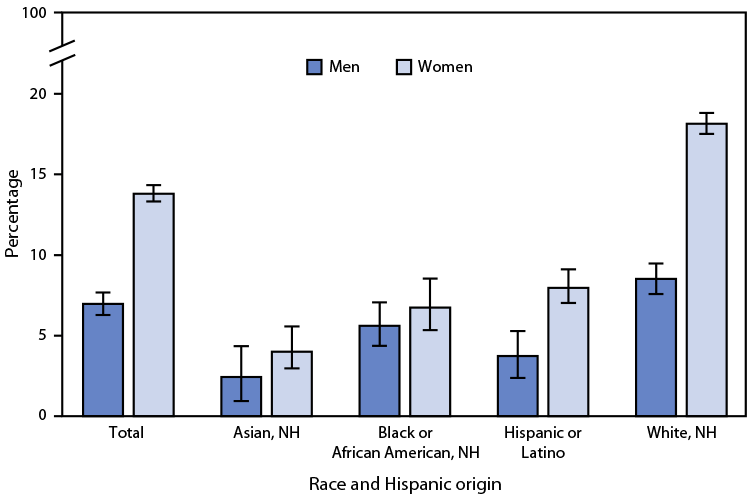
In 2021, among adults aged ≥18 years, women were more likely to take prescription medication for depression than were men (13.8% versus 7%). This pattern was found among non-Hispanic White (White) (18.1% versus 8.5%) and Hispanic or Latino (8.0% versus 3.7%) adults, but differences by sex were not statistically significant among non-Hispanic Black or African Read More >
Posted on byQuickStats: Percentage of Children and Adolescents Aged 5–17 Years Who Received Free or Reduced-Cost Meals at School During the Previous 12 Months, by Race and Hispanic Ethnicity and Family Income — National Health Interview Survey, United States, 2021
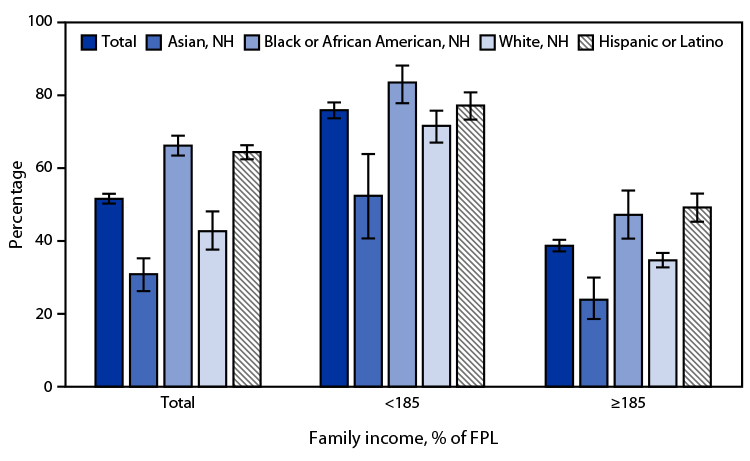
In 2021, 51.6% of all U.S. children and adolescents aged 5–17 years received free or reduced-cost meals at school during the previous 12 months; NH Black or African American (66.2%) and Hispanic or Latino (Hispanic) (64.4%) children and adolescents were more likely to receive free or reduced-cost meals at school than were NH White (42.7%) Read More >
Posted on byQuickStats: Age-Adjusted Percentage of Adults Aged ≥18 Years Who Had a Repetitive Strain Injury During the Past 3 Months, by Sex and Race and Hispanic Origin
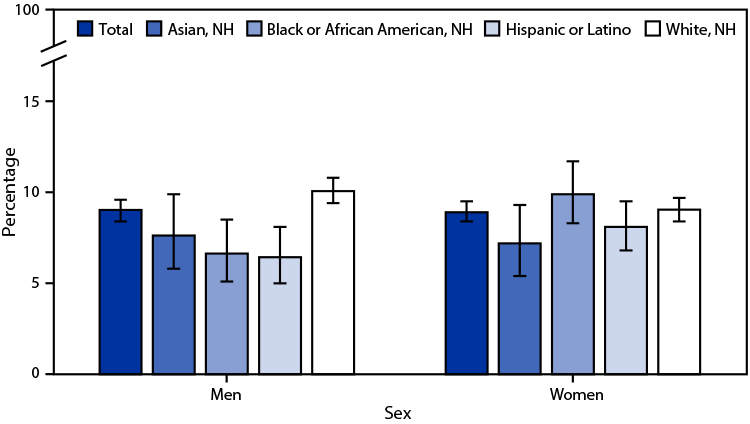
In 2021, 9.0% of men and 8.9% of women aged ≥18 years had a repetitive strain injury during the past 3 months. Non-Hispanic White men (10.1%) were more likely to have a repetitive strain injury than were non-Hispanic Asian (Asian) (7.6%), non-Hispanic Black or African American (Black) (6.6%), and Hispanic or Latino (Hispanic) (6.4%) men. Read More >
Posted on byQuickStats: Percentage of Adults Who Were in Families Having Problems Paying Medical Bills During the Previous 12 Months, by Race, Hispanic Origin, and Selected Asian Subgroups
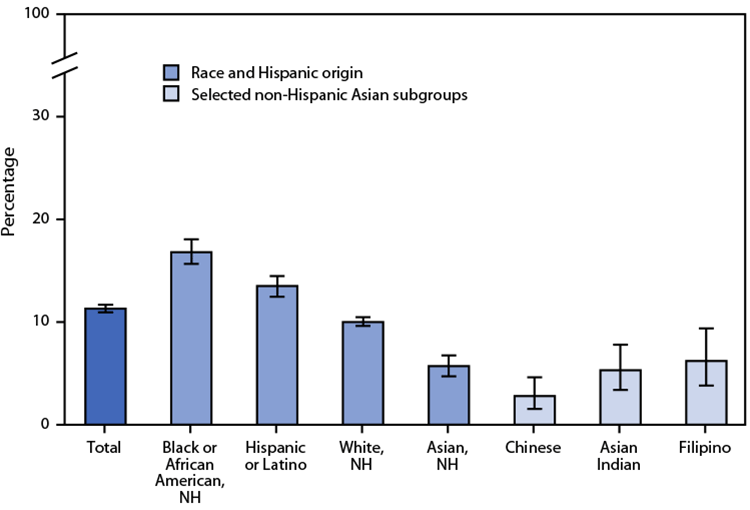
During 2020–2021, the percentage of U.S. adults who were in families having problems paying medical bills during the previous 12 months was 11.3%. Non-Hispanic Asian adults (5.7%) were the least likely to be in families having problems paying medical bills, followed by non-Hispanic White (10%), Hispanic or Latino (13.5%), and non-Hispanic Black or African American Read More >
Posted on byQuickStats: Percentage of Adults Who Were in Families Having Problems Paying Medical Bills During the Previous 12 Months, by Race and Selected Hispanic Origin Subgroups — National Health Interview Survey, United States, 2020−2021
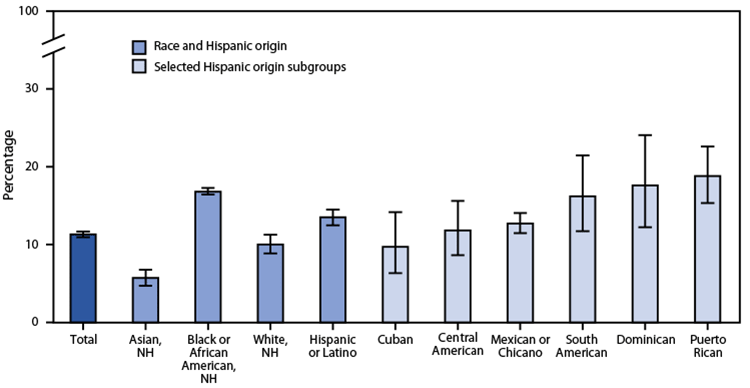
During 2020–2021, the percentage of U.S. adults who were in families having problems paying medical bills during the previous 12 months was 11.3%. Non-Hispanic Black or African American adults (16.8%) were most likely to be in families having problems paying medical bills followed by Hispanic or Latino (13.5%), non-Hispanic White (10.0%), and non-Hispanic Asian (5.7%) Read More >
Posted on byQ & A from Author of Emergency Department Visits Related to Mental Health Disorders Among Adults, by Race and Hispanic Ethnicity
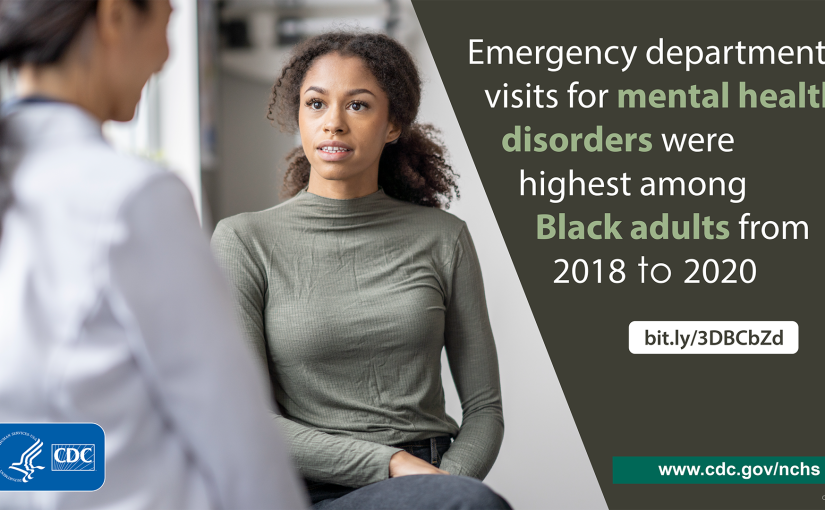
Q: Why did you decide to report on rates of emergency department (ED) visits for mental health disorders by race and ethnicity? ZP: As mentioned in the introduction of this report, prior research has shown that certain race/ethnicity groups are less likely to receive routine mental health care. Additionally, mental health disorders are frequently diagnosed at ED visits, Read More >
Posted on byNew Detailed Race and Ethnicity Data Query System

NCHS has released a new interactive data query system that allows users to search for data on adults about selected health topics by detailed race and ethnicity groups and subgroups in the United States. The new system provides estimates as three-year averages based on 2019-2021 final data from the National Health Interview Survey (NHIS). The three-year averages Read More >
Posted on byQuickStats: Age-Adjusted Percentage of Adults Aged 18 Years or Older With Arthritis, by Sex and Race and Hispanic Origin — National Health Interview Survey, United States, 2021
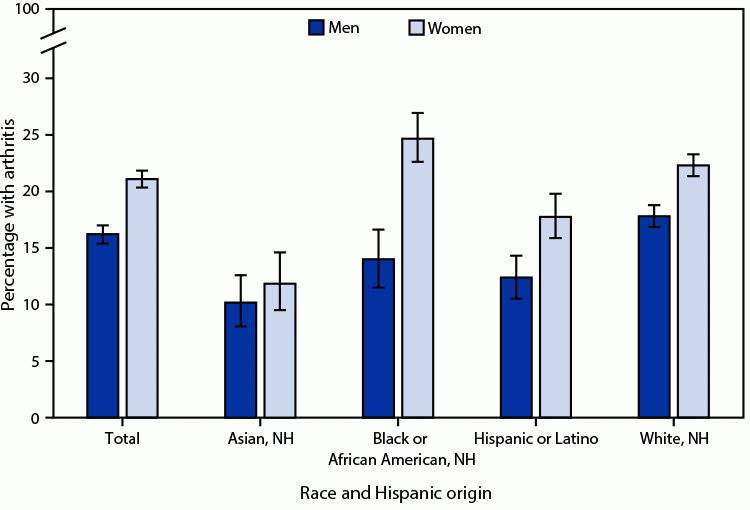
In 2021, among adults aged 18 years or older, women were more likely to have arthritis than men (21.0% versus 16.2%). This pattern was consistent among non-Hispanic White (White) (22.2% versus 17.7%), non-Hispanic Black or African American (Black) (24.6% versus 13.9%), and Hispanic or Latino (17.7% versus 12.4%) adults. Among non-Hispanic Asian (Asian) adults, the Read More >
Posted on byQuickStats: Death Rates for Drug Overdose Among Persons Aged 25–44 Years, by Race and Ethnicity— United States, 2000–2020
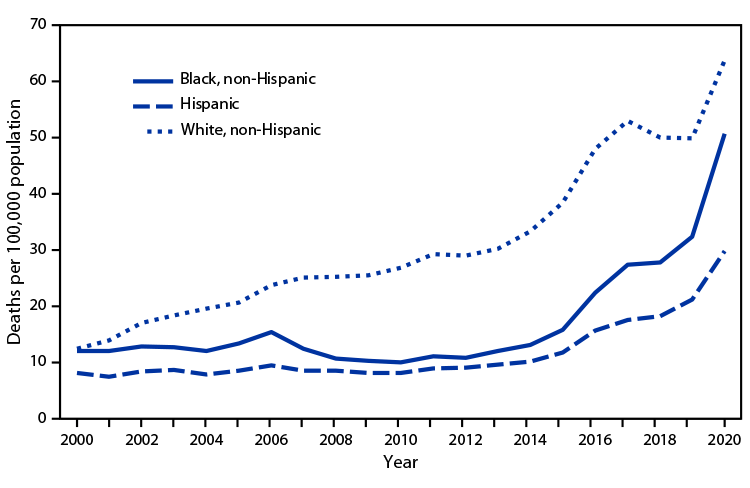
From 2000 to 2013, the rate for drug overdose death increased for non-Hispanic White (White) persons aged 25–44 years but was stable for non-Hispanic Black (Black) and Hispanic persons in this age group. From 2013 to 2020, rates increased for all groups, from 30.2 to 63.8 per 100,000 population for White persons, from 12.0 to Read More >
Posted on byNCHS Releases Two New Suicide Reports
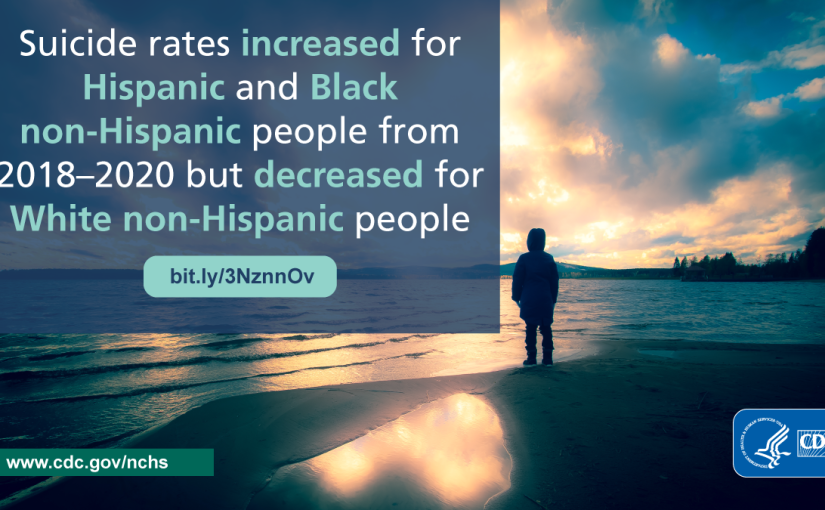
NCHS releases two new reports that look at suicide death rates in the United States. Suicide Rates for the Three Leading Methods by Race and Ethnicity: United States, 2000–2020 Description: This report presents suicide rates from 2000 to 2020 using final data for non-Hispanic White, non-Hispanic Black, and Hispanic people, for the total population and Read More >
Posted on byQuickStats: Age-Adjusted Death Rates from Stroke Among Adults Aged ≥65 Years, by Race and Hispanic Origin — National Vital Statistics System, United States, 2000–2020
Age-adjusted death rates from stroke among adults aged ≥65 years generally declined from 425.9 deaths per 100,000 standard population in 2000 to 250.0 in 2019 before increasing to 260.5 in 2020. During 2019–2020, stroke death rates increased for Hispanic adults (from 221.6 to 234.0), non-Hispanic Asian or Pacific Islander adults (from 203.9 to 216.4), non-Hispanic Read More >
Posted on byQuickStats: Percentage of Total Deaths, by Age and Hispanic Origin and Race — United States, 2020
Significant differences in the age distribution of deaths by race and ethnicity were observed in the United States during 2020. Decedents aged <65 years accounted for 26% of all U.S. deaths, but they accounted for approximately 50% of deaths among American Indian or Alaska Native (AI/AN) and Native Hawaiian or other Pacific Islander (NH/OPI) persons, Read More >
Posted on byQuickStats: Percentage of Uninsured Adults Aged 18−64 Years, by Race, Hispanic Origin, and Selected Asian Subgroups — National Health Interview Survey, United States, 2019−2020
During 2019–2020, the percentage of U.S. adults aged 18–64 years who were uninsured was 14.4%. Among all race and Hispanic origin groups, non-Hispanic Asian adults (7.8%) were the least likely to be uninsured followed by non-Hispanic White (9.7%), non-Hispanic Black (14.6%), and Hispanic adults (30.4%). Among the non-Hispanic Asian subgroups shown, adults of Korean (14.3%) Read More >
Posted on byQuickStats: Age-Adjusted Death Rates for Motor Vehicle Traffic Injury, by Race and Hispanic Origin — United States, 2019 and 2020
Age-adjusted death rates for motor vehicle traffic injury increased from 11.1 per 100,000 population in 2019 to 12.0 in 2020. The rates increased from 10.3 to 11.3 for Hispanic persons, from 14.5 to 18.3 for non-Hispanic Black persons, and from 11.2 to 11.6 for non-Hispanic White persons. The changes in rates among other groups were Read More >
Posted on byQuickStats: Age-Adjusted Suicide Rates for Males and Females, by Race and Ethnicity — National Vital Statistics System, United States, 2000–2020
After increasing from 2000 to 2018, age-adjusted suicide rates for non-Hispanic White males and females declined from 2018 to 2020, from 28.6 per 100,000 to 27.2 for males and from 8.0 to 6.9 for females. Rates for non-Hispanic Black males and Hispanic males were lower than that for non-Hispanic White males over the entire period Read More >
Posted on byQ & A with Author: Mortality Profile of the Non-Hispanic American Indian or Alaska Native Population, 2019
Questions for Elizabeth Arias, Health Statistician and Lead Author of “Mortality Profile of the Non-Hispanic American Indian or Alaska Native Population, 2019.” Q: Is the first report on non-Hispanic American Indian or Alaska Native (AIAN) mortality? EA: Yes. This is the first report that NCHS publishes exclusively on non-Hispanic AIAN mortality. Limited mortality statistics for Read More >
Posted on byQuickStats: Infant Mortality Rates for Metropolitan and Nonmetropolitan Counties by Single Race and Hispanic Origin — National Vital Statistics System, United States, 2019
In metropolitan counties, infant mortality rates were highest for infants of non-Hispanic Black mothers (10.60 infant deaths per 1,000 live births), followed by infants of non-Hispanic American Indian or Alaska Native (5.95), Hispanic (4.96), non-Hispanic White (4.22), and non-Hispanic Asian (3.34) mothers. In nonmetropolitan counties, the mortality rate was also highest for infants of non-Hispanic Read More >
Posted on byQuickStats: Age-Adjusted Rates of Firearm-Related Homicide by Race, Hispanic Origin, and Sex — National Vital Statistics System, United States, 2019
In 2019, among males, non-Hispanic Black males had the highest age-adjusted rate of firearm-related homicide at 34.9 per 100,000 population and non-Hispanic Asian/Pacific Islander males had the lowest rate (1.6). Among females, non-Hispanic Black females had the highest rate (4.1) and non-Hispanic Asian/Pacific Islander females had the lowest rate (0.5). Males had higher rates than Read More >
Posted on byQuickStats: Percentage of Adults Aged 20 Years or Older Who Consumed Fruit on a Given Day, by Race and Hispanic Origin — United States, 2015–2018
During 2015–2018, on a given day, 67.3% of adults aged ≥20 years consumed any fruit; 29.7% consumed citrus, melons, or berries; 47.5% consumed other whole fruits; and 30.8% consumed 100% fruit juice. Non-Hispanic Asian (76.5%) and Hispanic adults (72.2%) were more likely to consume any fruit on a given day than non-Hispanic White (66.3%) and Read More >
Posted on byQuickStats: Percentage of Adults Aged 18–26 Years Who Ever Received a Human Papillomavirus Vaccine, by Race and Hispanic Origin§ and Sex
Overall, in 2019, 47.0% of adults aged 18–26 years had ever received an HPV vaccination. Non-Hispanic White adults (49.7%) were more likely than Hispanic adults (40.6%) to have ever received an HPV vaccination; differences between non-Hispanic Black adults (45.8%) and the other two groups were not statistically significant. Overall, women were more likely than men Read More >
Posted on byTotal Fertility Rates, by Maternal Educational Attainment and Race and Hispanic Origin: United States, 2019
Questions for Brady Hamilton, Health Statistician and Lead Author of “Total Fertility Rates, by Maternal Educational Attainment and Race and Hispanic Origin: United States, 2019.” Q: What is the difference between general fertility rates and total fertility rates? BH: The general fertility rate is the number of births per 1,000 females aged 15–44 in a Read More >
Posted on by
