Category: motor vehicle traffic
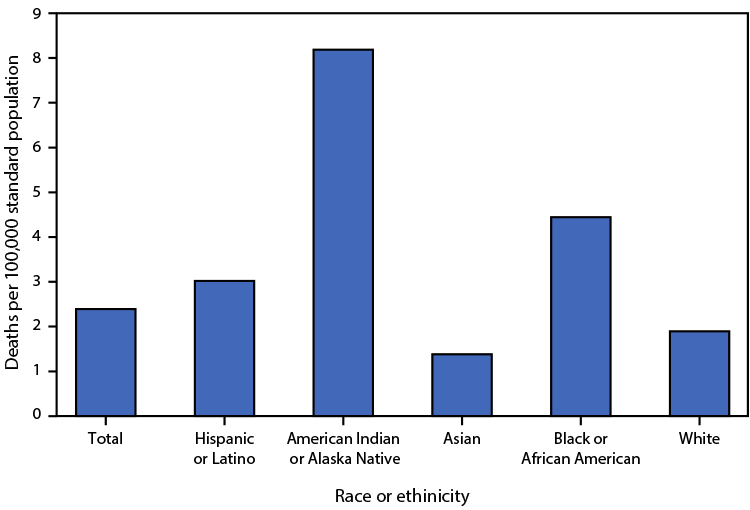
QuickStats: Age-Adjusted Death Rates, for Pedestrians Involved in a Collision with a Motor Vehicle, by Race and Hispanic Origin — National Vital Statistics System, United States, 2021

In 2021, a total of 8,392 deaths from pedestrian-involved collisions with motor vehicles occurred. The age-adjusted death rate from such collisions was highest for American Indian or Alaska Native persons (8.2 deaths per 100,000 standard population), followed by Black or African American (4.4), Hispanic or Latino (3.0), White (1.9), and Asian (1.4) persons. Source: National Vital Read More >
Posted on byQuickStats: Age-Adjusted Death Rates for Motor Vehicle Traffic Injury, by Race and Hispanic Origin — United States, 2019 and 2020
Age-adjusted death rates for motor vehicle traffic injury increased from 11.1 per 100,000 population in 2019 to 12.0 in 2020. The rates increased from 10.3 to 11.3 for Hispanic persons, from 14.5 to 18.3 for non-Hispanic Black persons, and from 11.2 to 11.6 for non-Hispanic White persons. The changes in rates among other groups were Read More >
Posted on byPODCAST: NHANES Updates, Drug Overdose Deaths, and ER Visits From Motor Vehicle Crashes
https://www.cdc.gov/nchs/pressroom/podcasts/2021/20210618/20210618.htm HOST: In March of 2020, field operations for the National Health and Nutrition Examination Survey – or NHANES – were halted due to the COVID-19 pandemic. Field operations are scheduled to restart later this summer. But the halt in operations presented a problem, since NHANES data traditionally is released in two-year cycles in order Read More >
Posted on byQuickStats: Age-Adjusted Death Rates for Four Selected Mechanisms of Injury — National Vital Statistics System, United States, 1979–2019
In 1979, of the four mechanisms of injury, age-adjusted mortality rates were highest for motor vehicle traffic deaths and lowest for drug poisoning deaths. From 1979 to 2019, the age-adjusted rate of motor vehicle traffic deaths decreased from 22.1 per 100,000 to 11.1, and the rate of firearm-related deaths decreased from 14.7 to 11.9. During Read More >
Posted on byMotor Vehicle Traffic Death Rates, by Sex, Age Group, and Road User Type: United States, 1999–2019
A new NCHS report provides national trends in motor vehicle traffic deaths by sex, age group, and type of road user (i.e., motor vehicle occupant, motorcyclist, pedestrian, or pedal cyclist) from 1999 through 2019 using the latest mortality data from the National Vital Statistics System. Findings: Motor vehicle traffic death rates were stable from 1999 Read More >
Posted on byQuickStats: Motor-Vehicle–Traffic Death Rates Among Persons Aged 15–24 Years and ≥25 Years — United States, 2000–2019
From 2000 to 2006, rates of death caused by motor-vehicle–traffic injuries among persons aged 15–24 years and ≥25 years did not change significantly. From 2006 to 2010, motor-vehicle–traffic death rates per 100,000 population declined among those aged 15–24 years, from 25.1 (2006) to 16.1 (2010), and among those aged ≥25 years, from 15.9 (2006) to Read More >
Posted on by
