Category: urban
QuickStats: Age-Adjusted Percentage of Adults Aged ≥18 Years with Diagnosed Chronic Obstructive Pulmonary Disease, by Urbanization Level — United States, 2023
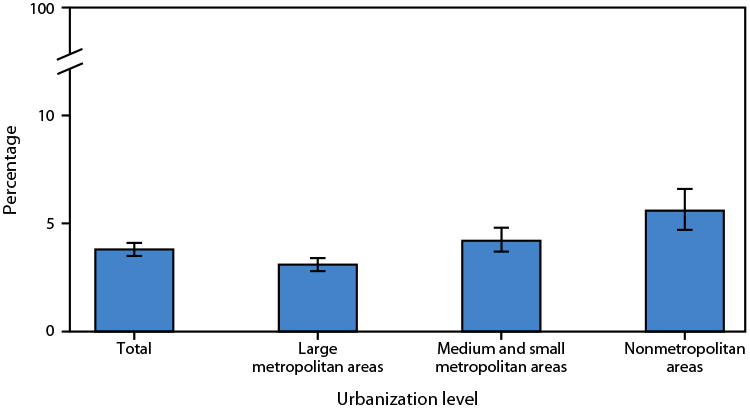
In 2023, the age-adjusted percentage of adults aged ≥18 years with diagnosed chronic obstructive pulmonary disease (COPD) was 3.8%. The prevalence of COPD among adults increased as urbanization level decreased. Supplementary Table: https://stacks.cdc.gov/view/cdc/168877 Source: National Center for Health Statistics, National Health Interview Survey, 2023. https://www.cdc.gov/nchs/nhis.htm https://www.cdc.gov/mmwr/volumes/73/wr/mm7346a5.htm Read More >
Posted on byNCHS Recognizes National Rural Health Day

Each year, we celebrate National Rural Health Day on the third Thursday of November. One in five people in the United States live in rural areas. Many of these residents face unique challenges that can affect health, such as higher poverty rates and less access to care. National Rural Health Day reminds us of the Read More >
Posted on byQuickStats: Percentage of Adults Aged ≥18 Years with Diagnosed Diabetes, by Urbanization Level and Age Group — National Health Interview Survey, United States, 2022
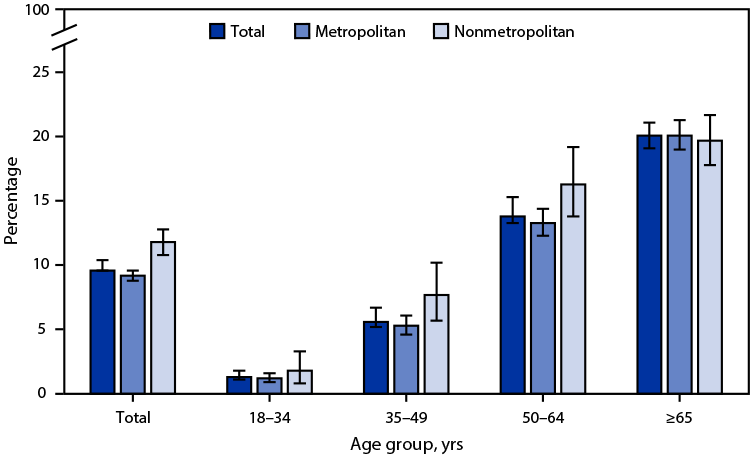
In 2022, 9.6% of adults aged ≥18 years had diagnosed diabetes, with the percentage lower among adults living in metropolitan areas (9.2%) compared with adults in nonmetropolitan areas (11.8%). The prevalence of diagnosed diabetes was lower in metropolitan areas only among those aged 35–49 years (5.3% versus 7.7%) and aged 50–64 years (13.3% versus 16.3%). Read More >
Posted on byQuickStats: Percentage of Adults Aged ≥18 Years Living in Families That Were Food-Insecure in the Past 30 Days by Family Income and Urbanicity — National Health Interview Survey, United States, 2021
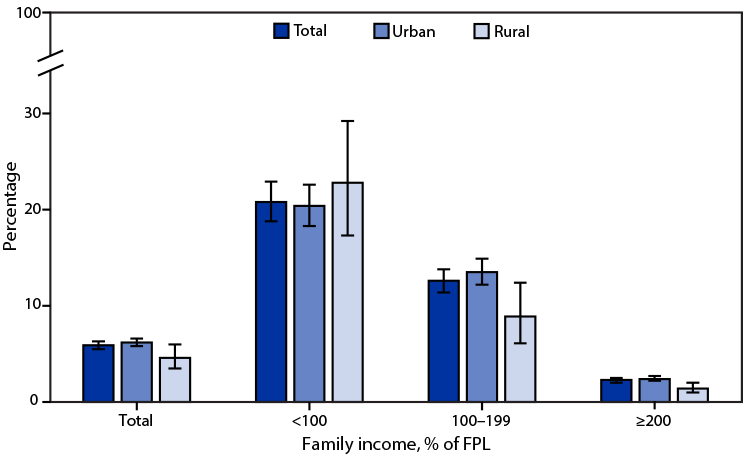
In 2021, 5.9% of adults aged ≥18 years lived in families that were food-insecure in the past 30 days. The percentage was higher in urban areas (6.2%) compared with rural areas (4.6%) overall and within households earning 100%–199% of FPL (13.5% versus 8.9%) and ≥200% of FPL (2.4% versus 1.4%). For adults living in families Read More >
Posted on byQuickStats: Drug Overdose Death Rates Among Persons Aged ≥15 Years, by Age Group and Urban-Rural Status — National Vital Statistics System, United States, 2020
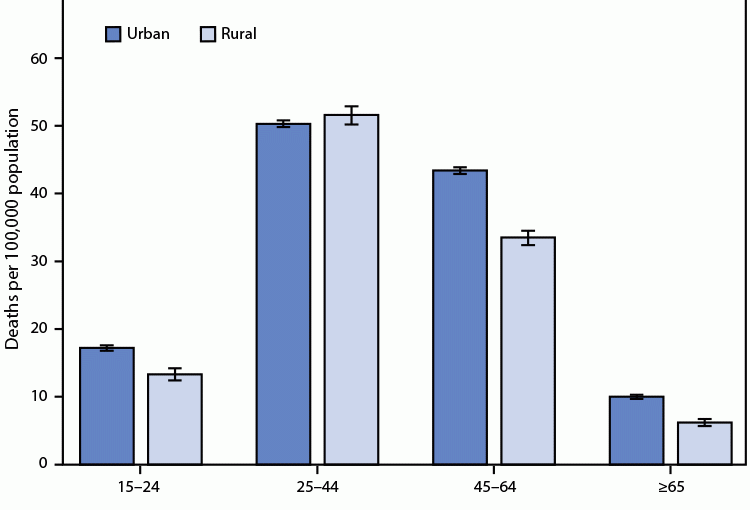
During 2020, death rates for drug overdose causes were higher in urban areas than in rural areas for those aged 15–24 years (17.2 compared with 13.3), 45–64 years (43.4 compared with 33.5), and ≥65 years (10.0 compared with 6.2). Among adults aged 25–44, drug overdose death rates were not significantly different between urban and rural Read More >
Posted on byQuickStats: Age-Adjusted Rates of Alcohol-Induced Deaths by Urban-Rural Status — United States, 2000–2020
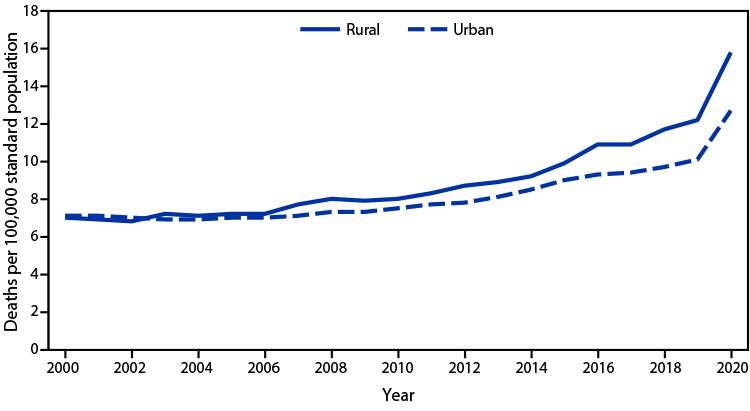
The age-adjusted rate of alcohol-induced deaths in 2020 was 13.1 per 100,000 standard population. From 2000 to 2020, the rate increased in both urban and rural counties: from 7.1 to 12.7 in urban counties and from 7.0 to 15.8 in rural counties. From 2019 to 2020, the rate increased by 26% for urban counties and 30% for rural counties, which Read More >
Posted on byQuickStats: Age-Adjusted Suicide Rates, by Urbanization Level and Sex — National Vital Statistics System, 2020
In 2020, age-adjusted suicide rates among females increased as the level of urbanization declined, from 4.6 per 100,000 population in large central metropolitan areas to 7.1 in small metropolitan areas, but were similar for small metropolitan, micropolitan, and noncore areas. Rates among males were lowest in large central areas (16.9) and increased as the level Read More >
Posted on byQuickStats: Percentage of Children and Adolescents Aged 6–17 Years Who Have Roads, Sidewalks, Paths, or Trails Where They Can Walk or Ride a Bicycle, by Urban-Rural Status and Family Income
During 2020, 88.7% of children and adolescents aged 6–17 years had roads, sidewalks, paths, or trails in their neighborhood or near their home where they could walk or ride a bicycle. Availability of these spaces was less common among children and adolescents who lived in families with incomes <200% of FPL (85.6%) than among those Read More >
Posted on byQuickStats: Age-Adjusted Percentage of Adults Aged ≥18 Years Who Met the 2018 Federal Physical Activity Guidelines for Both Muscle-Strengthening and Aerobic Physical Activity, by Urbanization Level — National Health Interview Survey, United States, 2020
In 2020, 25.3% of adults aged ≥18 years met the 2018 federal physical activity guidelines for both muscle-strengthening and aerobic physical activity. The percentage meeting both guidelines was highest in adults living in large central metropolitan (28.0%) and large fringe metropolitan areas (27.6%), followed by those living in medium and small metropolitan areas (23.4%) and Read More >
Posted on byQuickStats: Percentage of Adults Aged ≥18 Years with Diagnosed Heart Disease, by Urbanization Level and Age Group — National Health Interview Survey, United States, 2020
In 2020, 6.3% percent of adults aged ≥18 years had diagnosed heart disease. The prevalence of heart disease among adults aged ≥18 years was higher among those living in nonmetropolitan areas (8.8%) compared with those living in metropolitan areas (5.8%). Prevalence increased with age from 0.9% among adults aged 18–44 years to 5.9% among those Read More >
Posted on byQuickStats: Rate of Deaths Attributed to Unintentional Injury from Fire or Flames, by Sex and Urban-Rural Status — National Vital Statistics System, United States, 2020
In 2020, the death rate attributed to unintentional injury from fire or flames was higher in rural areas than in urban areas for females and males. The rate for females was 1.4 per 100,000 in rural areas and 0.6 in urban areas. The rate for males was 2.4 per 100,000 in rural areas and 0.9 Read More >
Posted on byQuickStats: Death Rates Attributed to Excessive Cold or Hypothermia, by Urbanization Level and Sex — National Vital Statistics System, 2018–2020
During 2018–2020, death rates attributed to excessive cold or hypothermia were generally higher in more rural areas. Among females, the death rate increased from 0.11 per 100,000 for those residing in large central metro areas, to 0.40 for those in noncore (rural) areas. Among males, the death rates were lowest for those residing in large Read More >
Posted on byQuickStats: Age-Adjusted Death Rates from Heart Disease Among Adults Aged 45–64 Years, by Urbanization Level and Sex — National Vital Statistics System, United States, 2019
In 2019, the age-adjusted death rate from heart disease among adults aged 45–64 years was 121.1 per 100,000 and was higher in rural counties (160.0) than urban counties (114.5). Among men, the age-adjusted death rate from heart disease was 221.4 in rural counties and 165.1 in urban counties. Among women, the age-adjusted death rate from Read More >
Posted on byQ & A with Author: Rural-urban Differences in Unintentional Injury Death Rates Among Children Aged 0-17: United States, 2018-2019
Questions for Matthew Garnett, Health Statistician and Lead Author of “Rural-urban Differences in Unintentional Injury Death Rates Among Children Aged 0-17: United States, 2018-2019.” Q: Can you describe what unintentional injury deaths are? MG: Unintentional injury deaths include fatal injuries that were unintended, unplanned, and did not occur on purpose. In contrast, intentional injuries include Read More >
Posted on byQ & A: Trends in Death Rates in Urban and Rural Areas: United States, 1999–2019
Questions for Sally Curtin, Health Statistician and Lead Author of “Trends in Death Rates in Urban and Rural Areas: United States, 1999–2019.” Q: Why did you decide to do a report comparing death rates in rural and urban areas? SC: In many of our reports, we have examined trends in various causes of death by Read More >
Posted on byQuickStats: Age-Adjusted Death Rates for Cancer, by Urban-Rural Status and Sex — National Vital Statistics System, United States, 1999–2019
Cancer death rates declined among males and females during 1999–2019 in urban areas from 249.6 per 100,000 to 168.4 for males and from 168.2 to 123.9 for females. Rates also declined in rural areas from 262.4 to 195.6 for males and from 165.4 to 139.2 for females. Throughout the period, cancer death rates were higher Read More >
Posted on byQuickStats: Percentage of Adults Aged 18 Years or Older With Fair or Poor Health by Urbanization Level and Age Group
In 2019, the percentage of adults aged 18 years or older reported to be in fair or poor health was higher among those living in nonmetropolitan areas (20.3%) than among those living in metropolitan areas (14.5%). Percentages in fair or poor health were higher in nonmetropolitan areas for those aged 18–39 years (10.9% versus 7.4%) Read More >
Posted on byUrban-rural Differences in Dental Care Use Among Adults Aged 18−64
Questions for Amy Cha, Health Statistician and Lead Author of “Urban-rural Differences in Dental Care Use Among Adults Aged 18−64.” Q: How does the data vary by sex, race, and income level? AC: In both urban and rural areas, the percentage of adults aged 18-64 who had a dental visit in the past 12 months Read More >
Posted on byQuickStats: Percentage of Adults Aged 18 Years or Older with Diagnosed Chronic Obstructive Pulmonary Disease, by Urbanization Level and Age Group — National Health Interview Survey, United States, 2019
In 2019, the percentage of adults aged 18 years or older with diagnosed chronic obstructive pulmonary disease (COPD) was higher among those living in nonmetropolitan areas (8.0%) than among those living in metropolitan areas (4.0%). Percentages were higher in nonmetropolitan areas for adults aged 45–64 years (10.0% versus 4.8%) and aged 65 years or older Read More >
Posted on byQuickStats: Percentage of Adults Aged 18 or Older with Diagnosed Diabetes by Urbanization Level and Age Group
In 2019, the percentage of adults aged 18 years or older with diagnosed diabetes was higher among those living in nonmetropolitan areas (12.4%) than among those living in metropolitan areas (8.9%). Percentages of adults with diagnosed diabetes were higher in nonmetropolitan than metropolitan areas for those aged 18–44 years (3.5% versus 2.3%) and 45–64 years Read More >
Posted on byUrban-Rural Differences in Drug Overdose Death Rates, 1999-2019
Questions for Holly Hedegaard, Health Statistician and Lead Author of “Urban-Rural Differences in Drug Overdose Death Rates, 1999-2019.” Q: How do drug overdose death rates in urban and rural areas compare? HH: Over the past 20 years, rates of drug overdose deaths have increased in both urban and rural areas. Rates in rural areas were Read More >
Posted on byQuickStats: Death Rates Attributed to Excessive Cold or Hypothermia† Among Persons Aged15 Years or older, by Urban-Rural Status and Age Group
In 2019, among persons aged 15 years or older, death rates attributed to excessive cold or hypothermia were higher in rural areas than in urban areas across every age group. Crude rates were lowest among those aged 15–34 years at 0.2 and 0.5 per 100,000 population in urban and rural areas, respectively. Rates increased with Read More >
Posted on byMotor Vehicle Traffic Death Rates Among Adolescents and Young Adults Aged 15–24, by Urbanicity: United States, 2000–2018
Questions for Sally Curtin, Health Statistician and Lead Author of “Motor Vehicle Traffic Death Rates Among Adolescents and Young Adults Aged 15–24, by Urbanicity: United States, 2000–2018.” Q: Was there a specific finding in the data that surprised you from this report? SC: The finding that the difference in MVT death rates between persons aged Read More >
Posted on byQuickStats: Rates of Deaths Attributed to Unintentional Injury from Fire or Flames by Age Group and Urbanization Level
In 2018, the death rates attributed to unintentional injury from fire or flames were lowest among those aged 15–24 years and highest among those aged 75 years or older. In rural areas, death rates decreased with age from 2.0 per 100,000 for persons aged 0–4 years to 0.3 for those aged 15–24 years, and then Read More >
Posted on byPrevalence of Children Aged 3–17 Years With Developmental Disabilities, by Urbanicity: United States, 2015–2018
Questions for Ben Zablotsky, Ph.D., Health Statistician and Lead Author of “Prevalence of Children Aged 3–17 Years With Developmental Disabilities, by Urbanicity: United States, 2015–2018.” Q: Why did you decide to focus on urbanicity among children with developmental disabilities? BZ: Thanks to previous research, we know that children with developmental disabilities typically require more health Read More >
Posted on by
