Category: Deaths
QuickStats: Age-Adjusted Colorectal Cancer Death Rates, by State — United States, 2024

In 2024, the U.S. colorectal cancer death rate was 12.9 deaths per 100,000 standard population. Rates were generally lower in the Northeast and higher in the South. Colorectal cancer death rates were highest in Oklahoma (17.8) and lowest in Rhode Island (10.1). Supplementary Table: https://stacks.cdc.gov/view/cdc/256552#tabs-3 Source: National Center for Health Statistics, National Vital Statistics System, Mortality Data, Read More >
Posted on byCDC “Stats of the States” — 2024 State Data Update

The CDC’s National Center for Health Statistics updated its “Stats of the States” pages with the final 2024 state-level data on selected vital statistics topics, including— General fertility rates Teen birth rates Leading causes of death Other major causes of death The map pages let you sort and compare states from highest to lowest (or Read More >
Posted on byMost Common Drugs in U.S. Overdose Deaths: 2017–2023

CDC’s National Center for Health Statistics (NCHS) has released a new report titled “Drugs Most Frequently Involved in Drug Overdose Deaths: United States, 2017–2023.” This report provides a detailed look at drug overdose deaths across the country over a seven-year period. This analysis focuses on the specific drugs involved in overdose deaths, using written documentation Read More >
Posted on bySuicide Rates Largely Unchanged in 2023, but Still High

A new NCHS report, “Changes in Suicide Rates in the United States From 2022 to 2023,” sheds light on the trends surrounding suicide rates over the past two decades. This report tracks the statistics from 2003 to 2023 and focuses on notable changes in 2022 and 2023. Recent Stability in Overall Rates From 2003 to Read More >
Posted on byNCHS Provisional Report on U.S. Mortality for 2024
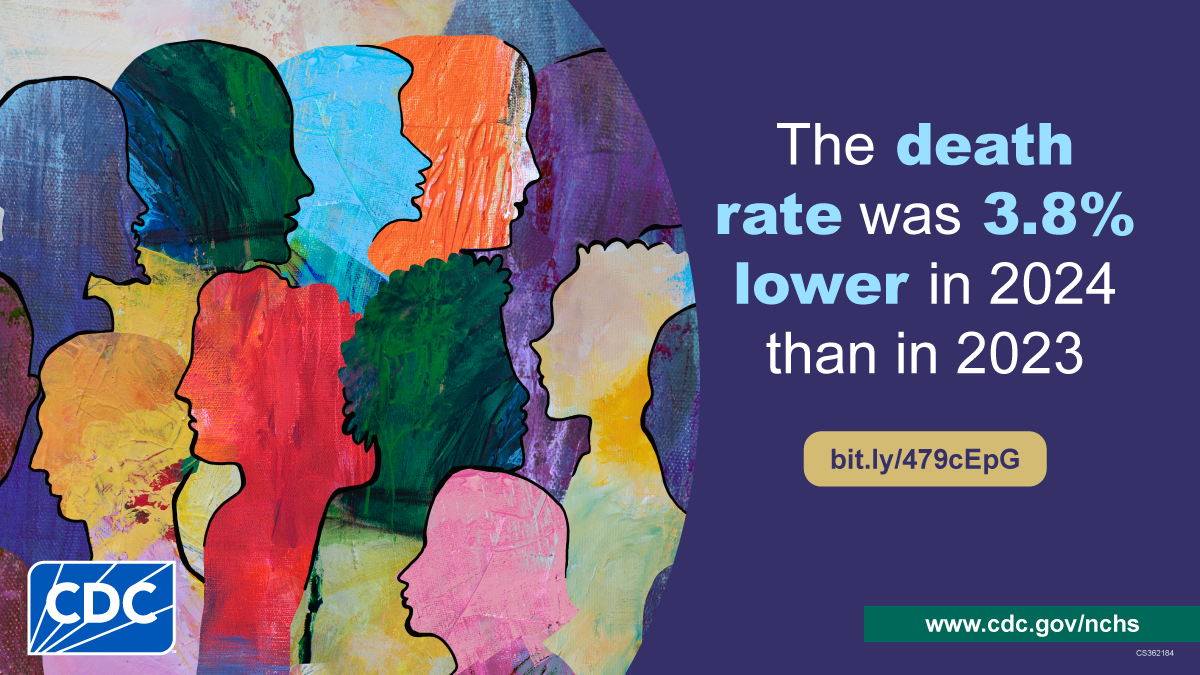
NCHS has just released a new report titled “Mortality in the United States: Provisional Data, 2024.” This report offers an early snapshot of death rates across the country, breaking down the data by age, sex, race, and Hispanic origin. It also highlights the leading causes of death in the United States. According to the report, Read More >
Posted on byNew Reports Confirm U.S. Life Expectancy Increased while Drug Overdose Deaths Decreased in 2023
U.S. life expectancy increased in 2023, reaching its highest level since the COVID-19 pandemic, according to final mortality data released today. The data are featured in two new reports from CDC’s National Center for Health Statistics (NCHS). “Mortality in the United States: 2023” is the first public release of final mortality data for 2023. The Read More >
Posted on byQuickStats: Percentage Distribution of Deaths Involving Injuries from Recreational and Nonrecreational Use of Watercraft, by Month — United States, 2020–2022
During 2020–2022, a total of 1,481 deaths occurred involving injuries from recreational and nonrecreational use of watercraft. The highest percentage of these deaths (17.4%) occurred in July, with the majority occurring during May–September. Supplementary Table: https://stacks.cdc.gov/view/cdc/155045 Source: National Center for Health Statistics, National Vital Statistics System, Mortality Data, 2020–2022. https://www.cdc.gov/nchs/nvss/deaths.htm Read More >
Posted on byU.S. Overdose Deaths Decrease in 2023, First Time Since 2018

Provisional data from CDC’s National Center for Health Statistics indicate there were an estimated 107,543 drug overdose deaths in the United States during 2023—a decrease of 3% from the 111,029 deaths estimated in 2022. This is the first annual decrease in drug overdose deaths since 2018. The data are featured in an interactive web data visualization. Read More >
Posted on byFrom Numbers to Knowledge: Building America’s Mortality Report
Today, the National Center for Health Statistics (NCHS) released final mortality data for 2022 and an accompanying data brief, “Mortality in the United States: 2022.” In 2022, 3,279,857 resident deaths were registered in the United States. When it comes to understanding the health of the nation, this annual data brief provides a key piece of Read More >
Posted on byQuickStats: Average Number of Stroke Deaths per Day, by Month and Sex — National Vital Statistics System, United States, 2021
In 2021, the average number of stroke deaths per day was highest in January (275 for females and 212 for males) and then declined to a monthly low in June (235 for females and 180 for males). Beginning in July, the average number of stroke deaths per day increased for each successive month through the Read More >
Posted on byLife Expectancy Increases, However Suicides Up in 2022

CDC’s National Center for Health Statistics released two reports today examining provisional mortality data from 2022. While analysis shows the number and rate of suicides increased for the second year in a row from, overall life expectancy at birth increased by just over a year. This increase regains some of the 2.4 years of life Read More >
Posted on byFetal Mortality Declined 5% Between 2021 and 2022
According to analysis of data from the National Vital Statistics System, the overall fetal mortality rate in the United States declined 5% between 2021 and 2022, from 5.73 fetal deaths per 1,000 live births and fetal deaths to 5.45. The Vital Statistics Rapid Release, “Fetal Mortality in the United States: Final 2020-2021 and 2021-Provisional 2022” Read More >
Posted on byInfant Mortality Rate Sees First Rise in 20 Years
A new Vital Statistics Rapid Release report from the National Center for Health Statistics shows that the provisional infant mortality rate for the United States in 2022 rose 3% from 2021, the first year-to-year increase in the rate since 2001 to 2002. From 2002 to 2021 the infant mortality rate declined 22%. Detailed findings in Read More >
Posted on byQuickStats: Age-Adjusted Death Rates for Stroke, by Region — National Vital Statistics System, United States, 2001–2021
The age-adjusted death rate for stroke declined for all regions from 2001 to 2021. Stroke death rates declined from 2001 through 2013 for persons living in the South (63.0 to 39.5 per 100,000 population) and Midwest (59.4 to 37.4), through 2014 for persons living in the West (60.9 to 33.8), and through 2019 for persons Read More >
Posted on byQuickStats: Sepsis-Related Death Rates Among Persons Aged ≥65 Years, by Age Group and Sex — National Vital Statistics System, United States, 2021
In 2021, the sepsis-related death rate among persons aged ≥65 years was 330.9 deaths per 100,000 population; the rate among men (371.7) was higher than that among women (297.4). Sepsis-related death rates among men were higher than those among women in each age group: 232.7 versus 173.0 (65–74 years), 477.3 versus 349.8 (75–84 years), and Read More >
Posted on byQuickStats: Number of Deaths Resulting from Being Bitten or Struck by a Dog, by Sex — National Vital Statistics System, United States, 2011–2021
During 2011–2021, a total of 468 deaths from being bitten or struck by a dog occurred (average = 43 deaths per year). The annual number of deaths ranged from 31 (2016) to 81 (2021). During 2011–2016, more deaths occurred among males than among females during most years; however, during 2017–2021, more deaths occurred among females Read More >
Posted on byQuickStats: Age-Adjusted Rates of Death Involving Exposure to Excessive Heat Among States with the Highest Numbers of Deaths — National Vital Statistics System, United States, 2021
The 2021 age-adjusted heat-related death rate for the United States was 0.4 deaths per 100,000 population. A total of 1,600 deaths were reported, and nine states accounted for >75% (1,226) of those deaths. Arizona recorded 426 deaths and had the highest rate (5.2 per 100,000), followed by Nevada (4.6), Oregon (2.4), Washington (1.9), and Louisiana Read More >
Posted on byQuickStats: Unintentional Drowning Death Rates of Children and Adolescents Aged 0–17 Years, by Sex and Age Group — United States, 2020–2021
During 2020–2021, the unintentional drowning death rate was 1.1 deaths per 100,000 population among children and adolescents aged 0–17 years. Rates were higher among males (1.5) than females (0.7). Among children aged <1 year, boys and girls had similar unintentional drowning death rates (1.0), whereas rates were higher for males than for females among those Read More >
Posted on byQuickStats: Number of Deaths from Hornet, Wasp, and Bee Stings Among Males and Females — National Vital Statistics System, United States, 2011–2021
During 2011–2021, a total of 788 deaths from hornet, wasp, and bee stings occurred (an average of 72 deaths per year). The annual number of deaths ranged from 59 (2012) to 89 (2017). Overall, 84% of deaths occurred among males. Source: National Center for Health Statistics, National Vital Statistics System, Mortality Data, 2011–2021. https://wonder.cdc.gov/Deaths-by-Underlying-Cause.html Read More >
Posted on byQuickStats: Age-Adjusted Death Rates, for Pedestrians Involved in a Collision with a Motor Vehicle, by Race and Hispanic Origin — National Vital Statistics System, United States, 2021
In 2021, a total of 8,392 deaths from pedestrian-involved collisions with motor vehicles occurred. The age-adjusted death rate from such collisions was highest for American Indian or Alaska Native persons (8.2 deaths per 100,000 standard population), followed by Black or African American (4.4), Hispanic or Latino (3.0), White (1.9), and Asian (1.4) persons. Source: National Vital Read More >
Posted on bySuicide and Homicide Rates Increase Among Young Americans

NCHS released a new report that uses the most recent data from the National Vital Statistics System (NVSS) to update a previous report. The report presents trends from 2001 to 2021 in suicide and homicide rates for young people ages 10‒24 and for age groups 10‒14, 15‒19, and 20‒24. Findings: After no significant change between Read More >
Posted on byColon Cancer Deaths in the United States: 1999-2021

Year Deaths Age Adjusted Rate* 1999 48,433 17.7 2000 48,570 17.6 2001 47,860 17 2002 47,586 16.6 2003 46,868 16.1 2004 44,591 15.1 2005 43,989 14.6 2006 44,061 14.3 2007 43,969 14 2008 43,396 13.6 2009 42,199 12.9 2010 42,009 12.6 2011 41,822 12.2 2012 41,488 11.9 2013 41,502 11.6 2014 41,526 11.4 2015 42,126 Read More >
Posted on byNew Report Confirms U.S. Life Expectancy has Declined to Lowest Level Since 1996

U.S. Life Expectancy decreased in 2021 for the second consecutive year, according to final mortality data released today. The drop was primarily due to increases in COVID-19 and drug overdose deaths. The data are featured in two new reports from CDC’s National Center for Health Statistics (NCHS). “Mortality in the United States: 2021” features the Read More >
Posted on byMore Than 3,500 Americans Have Died from Long COVID-Related Illness in the First 30 Months of the Pandemic
Death certificate analysis shows that long COVID played a part in 3,544 deaths in the United States from January 2020 through the end of June 2022. Long COVID deaths represented less than 1% of the 1,021,487 deaths for which COVID-19 was the underlying or contributing cause of death in that period. These findings are included Read More >
Posted on byDrug & Alcohol Deaths on the Rise Among Older Americans

Drug and alcohol abuse have impacted seniors in the United States as it has among younger Americans. Over 5,000 people ages 65 and over in the U.S. died of a drug overdose in 2020, and more than twice that many (11,616) died of alcohol-induced causes. The data are featured in two new reports released today Read More >
Posted on by