NCHS: A Blog of the National Center for Health Statistics
U.S. Overdose Deaths Decrease in 2023, First Time Since 2018

Provisional data from CDC’s National Center for Health Statistics indicate there were an estimated 107,543 drug overdose deaths in the United States during 2023—a decrease of 3% from the 111,029 deaths estimated in 2022. This is the first annual decrease in drug overdose deaths since 2018. The data are featured in an interactive web data visualization. Read More >
Posted on byExplore NCHS Research at the AAPOR Annual Conference
Researchers from the National Center for Health Statistics (NCHS) will present their work at the American Association for Public Opinion Research (AAPOR) 79th annual conference being convened May 15–17 at the Hilton Atlanta. The conference brings together researchers to focus on the theme of “Impacting Communities: Surveys, Public Opinion Research, and Engaged Scholarship” and to Read More >
Posted on byIntroducing the NCHS Data Query System
In today’s ever-changing public health landscape, access to comprehensive data is essential for informed decision-making. That’s why the Centers for Disease Control and Prevention’s National Center for Health Statistics (NCHS) has launched its newest tool: the Data Query System (DQS). DQS brings together data from major NCHS and external sources into one easy-to-use online tool. Read More >
Posted on byQuickStats: Percentage of Residential Care Communities That Use Electronic Health Records, by Community Bed Size — United States, 2018, 2020, and 2022
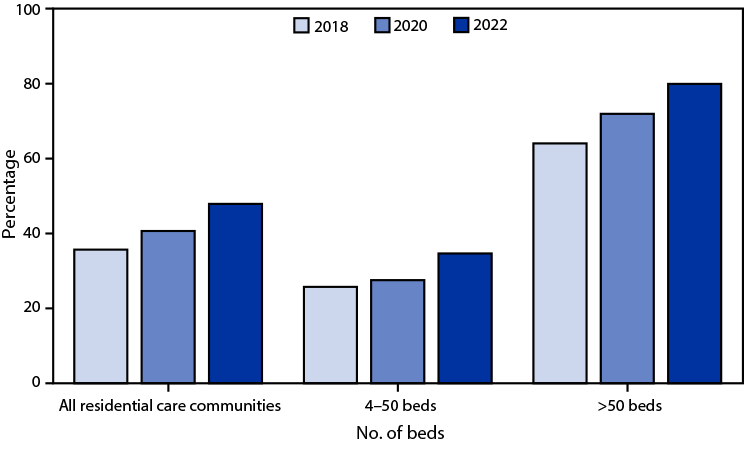
From 2018 to 2022, the percentage of residential care communities (RCCs) using electronic health records (EHRs) increased from 36% to 48%. Use of EHRs increased during this time regardless of RCC size, and larger RCCs were more likely to use EHRs compared with smaller RCCs. Supplementary Table: https://stacks.cdc.gov/view/cdc/153378 Source: National Center for Health Statistics, National Post-acute and Read More >
Posted on bySecond Round of Health Data Released by NCHS Rapid Surveys System
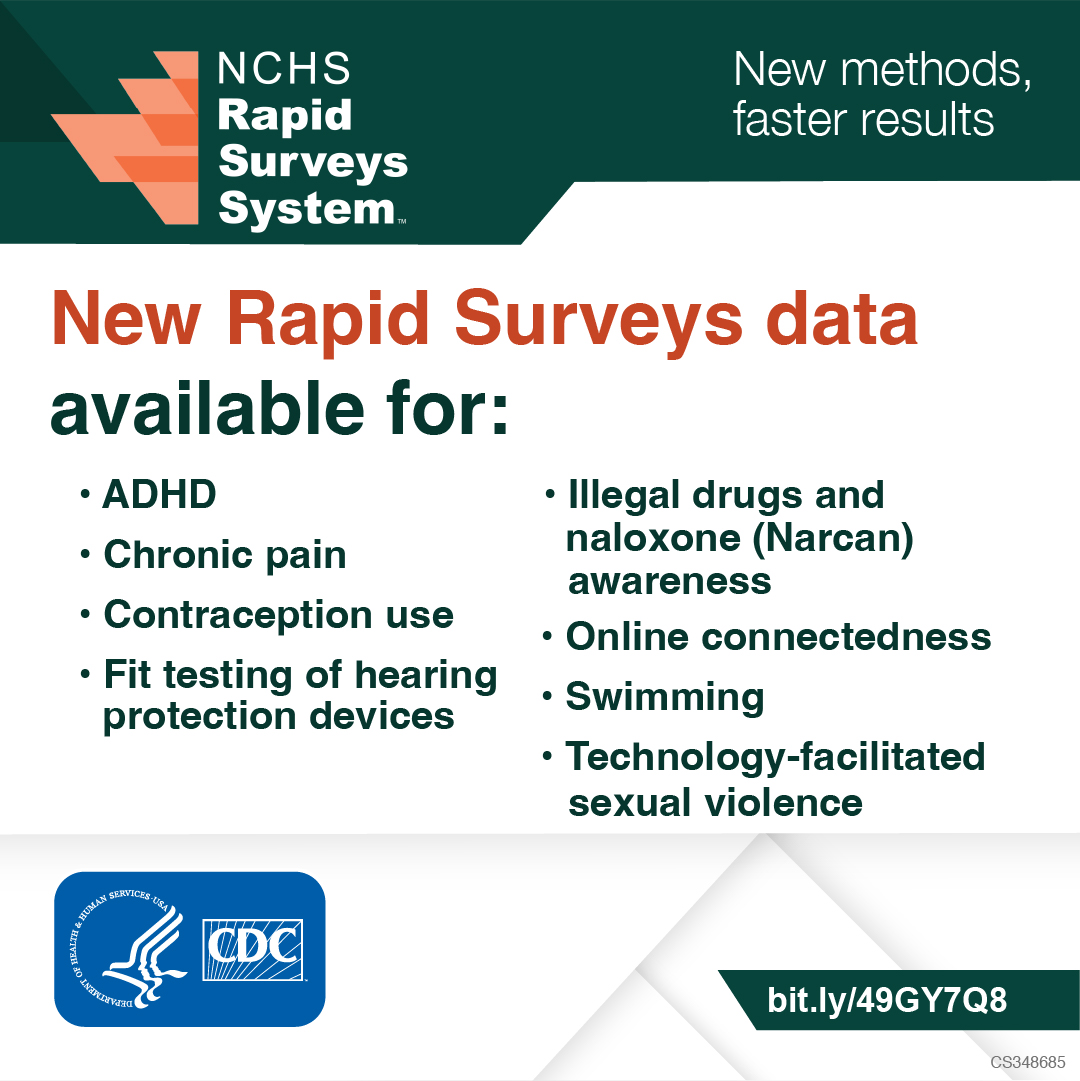
CDC’s National Center for Health Statistics has released the second round of survey data from the Rapid Surveys System. This survey includes topics such as: ADHD Chronic Pain Contraception Use Fit Testing of Hearing Protection Devices Illegal Drugs and Naloxone (Narcan) Awareness Online Connectedness Swimming Technology-facilitated Sexual Violence Topics included in Rapid Surveys will vary Read More >
Posted on byNew National Hospital Care Survey Public Use Files Released

The National Center for Health Statistics’s (NCHS’s) Division of Health Care Statistics has officially released the 2020 National Hospital Care Survey public use data files. These files include detailed data on inpatient stays and emergency department visits to hospitals across the United States. The release of these data files is one of several historic achievements Read More >
Posted on byU.S. Fertility Rate Drops to Another Historic Low
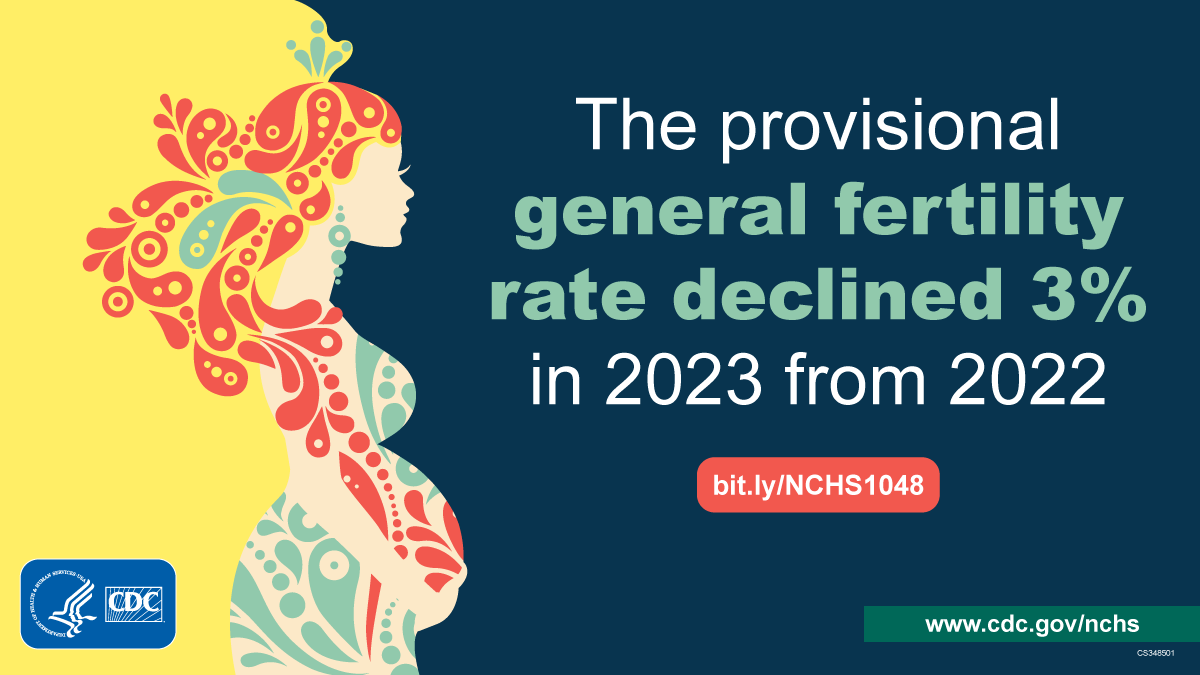
The general fertility rate in the United States decreased by 3% from 2022, reaching a historic low. This marks the second consecutive year of decline, following a brief 1% increase from 2020 to 2021. From 2014 to 2020, the rate consistently decreased by 2% annually. These statistics and others from provisional 2023 birth data were Read More >
Posted on byQuickStats: Percentage of Children and Adolescents Aged 3–17 Years Who Ever Received a Diagnosis of Autism Spectrum Disorder, by Family Income, 2020–2022
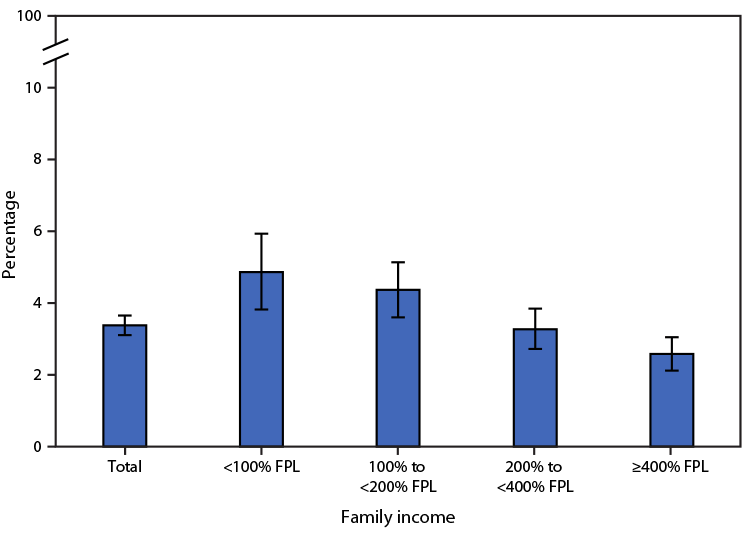
During 2020–2022, 3.4% of children and adolescents aged 3–17 years had received a diagnosis of autism spectrum disorder. The prevalence of autism spectrum disorder among children and adolescents decreased as family income increased. Supplementary Table: https://stacks.cdc.gov/view/cdc/152917 Source: National Center for Health Statistics, National Health Interview Survey, 2020–2022. https://www.cdc.gov/nchs/nhis.htm https://www.cdc.gov/mmwr/volumes/73/wr/mm7315a5.htm Read More >
Posted on byBeyond the Checkbox: New Standards for Health Data
Accurate data on race and ethnicity are essential for understanding the health of different populations. This information helps support public health programs and research. On March 28, 2024, the Office of Management and Budget (OMB) changed the way NCHS and other statistical agencies will be collecting data on race and ethnicity. OMB is responsible for Read More >
Posted on byQuickStats: Life Expectancy at Birth, by Sex — United States, 2019–2022
Life expectancy at birth for the U.S. population in 2022 was 77.5 years, an increase from 76.4 years in 2021. Although life expectancy rose in 2022 for the first time since the COVID-19 pandemic began, it remains lower compared with prepandemic life expectancy in 2019 (78.8 years). This pattern was similar for males and females. Read More >
Posted on byFrom Numbers to Knowledge: Building America’s Mortality Report
Today, the National Center for Health Statistics (NCHS) released final mortality data for 2022 and an accompanying data brief, “Mortality in the United States: 2022.” In 2022, 3,279,857 resident deaths were registered in the United States. When it comes to understanding the health of the nation, this annual data brief provides a key piece of Read More >
Posted on byMarriages in the U.S. in 2022 Returned to Pre-Pandemic Levels

In 2022, the United States witnessed a significant uptick in the number of marriages, reaching a total of 2,065,905[1]. This marked the first instance of surpassing the 2 million mark since 2019 when the figure stood at 2,015,603. The marriage rate also experienced a significant increase, reaching 6.2 per 1,000 population – the highest rate Read More >
Posted on byQ & A from the Report Author of Chronic School Absenteeism
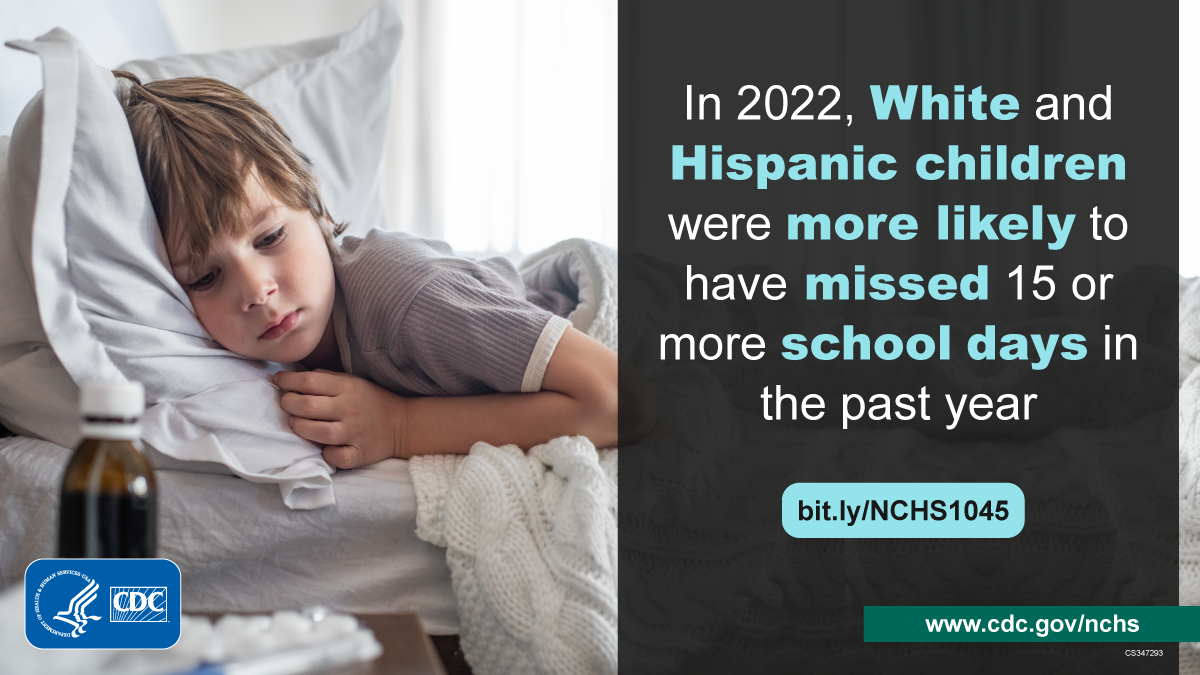
Questions for Lindsey Black, Statistician and Lead Author of “Chronic School Absenteeism for Health-related Reasons Among Children Ages 5‒17 Years: United States, 2022” Q: What would you say was the most significant finding in this report? LB: There are few national data sources available to examine the prevalence of school absenteeism due to health-related reasons. Read More >
Posted on byQuickStats: Percentage of Children and Adolescents Aged 5–17 Years Who Had Chronic School Absenteeism Due to Illness, Injury, or Disability During the Past 12 Months, by Age Group and Year — National Health Interview Survey, United States, 2019 and 2022
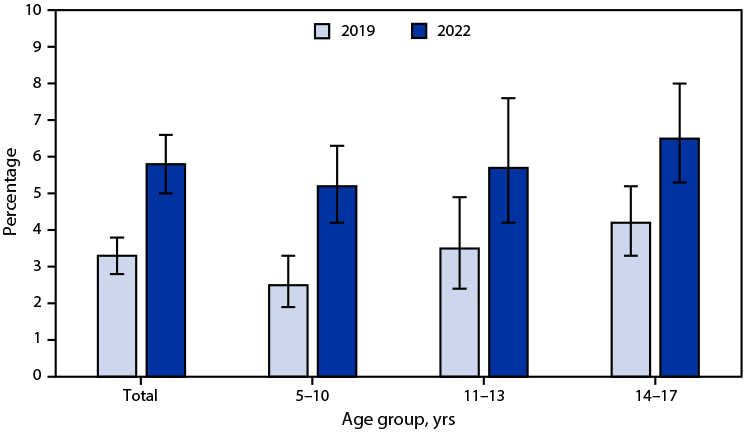
The percentage of children and adolescents aged 5–17 years who had chronic school absenteeism during the past 12 months was higher in 2022 (5.8%) than in 2019 (3.3%). From 2019 to 2022, the percentage of children who had chronic school absenteeism increased for each age group. The percentage of children who had chronic school absenteeism Read More >
Posted on byQuickStats: Percentage of Adults Aged ≥18 Years Who Lacked Reliable Transportation for Daily Living in the Past 12 Months, by Disability Status and Age Group — National Health Interview Survey, United States, 2022
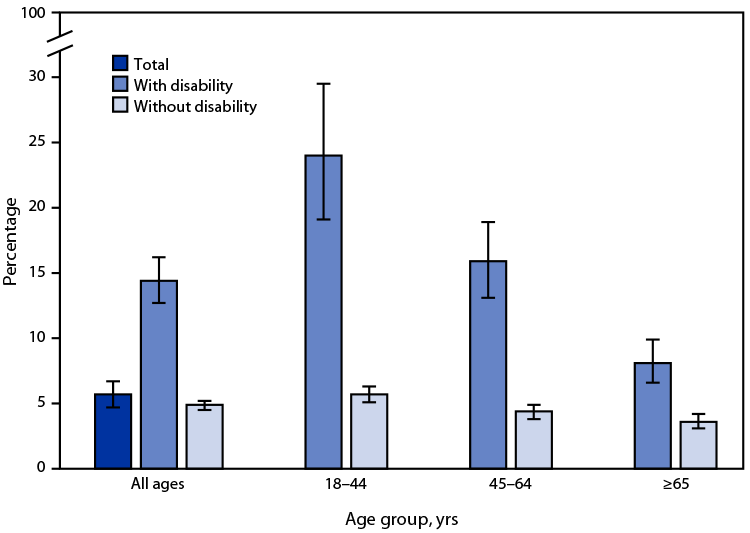
In 2022, 5.7% of adults aged ≥18 years lacked reliable transportation for daily living in the past 12 months. The percentage lacking reliable transportation for daily living among those with disability was higher (14.4%) compared with those without disability (4.9%). The percentages among persons with disability were higher than percentages among those without disability in Read More >
Posted on byThe National Center for Health Statistics Launches New Rapid Surveys System
Rapid and reliable response to public health needs has never been more crucial than in today’s world. The National Center for Health Statistics is now partnering with other CDC programs and government survey experts to fill information gaps by providing access to timely data through its new Rapid Surveys System. WHAT ARE RAPID SURVEYS? Rapid Read More >
Posted on byQuickStats: Percentage of Newborns Breastfed Between Birth and Discharge from Hospital, by Maternal Age — National Vital Statistics System, 49 States and the District of Columbia, 2021 and 2022
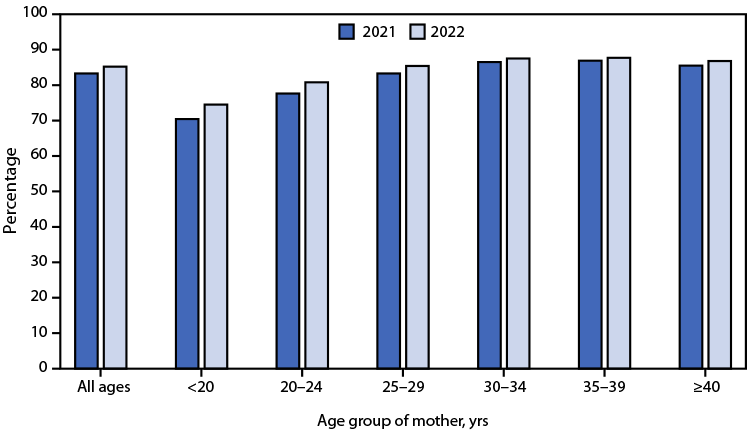
Among 49 states and the District of Columbia, the percentage of newborns breastfed between birth and discharge from the hospital increased from 83.3% in 2021 to 85.2% in 2022. Increases were observed for each maternal age group; the largest increases occurred among younger maternal age groups (70.4% to 74.5% among mothers aged <20 years and Read More >
Posted on byQ & A from the Report Author of Telemedicine Use Among Physicians

Questions for Kelly Myrick, Statistician and Lead Author of “Telemedicine Use Among Physicians by Physician Specialty: United States, 2021.” Q: Why did you decide to do a report on telemedicine usage among physicians? KM: Telemedicine technology is a shared topic of interest of the coauthors. We wanted to explore telemedicine technology by physician specialty on Read More >
Posted on byQuickStats: Percentage of Children and Adolescents Aged ≤17 Years Who Visited an Urgent Care Center or a Clinic in a Drug Store or Grocery Store in the Past 12 Months, by Age Group and Year — National Health Interview Survey, United States, 2021–2022
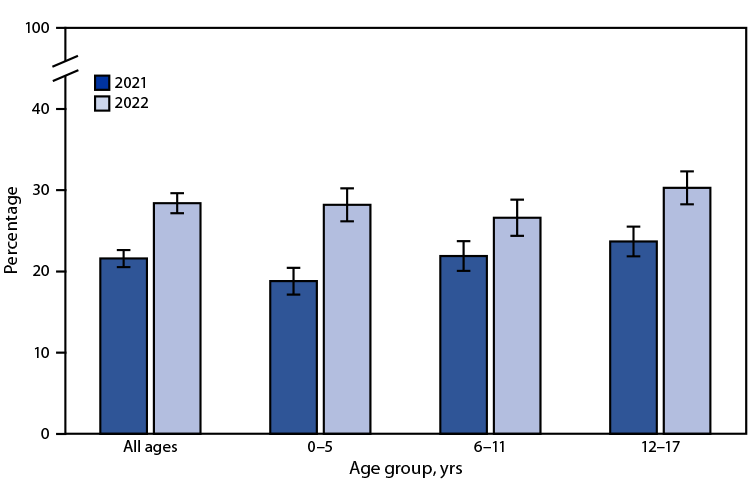
The percentage of children and adolescents aged ≤17 years who had at least one visit to an urgent care center or a clinic in a drug store or grocery store in the past 12 months increased from 21.6% in 2021 to 28.4% in 2022. This increase was noted for all age groups during 2021–2022. In Read More >
Posted on byQuickStats: Percentage of Adults Aged ≥18 Years with Diagnosed Diabetes, by Urbanization Level and Age Group — National Health Interview Survey, United States, 2022
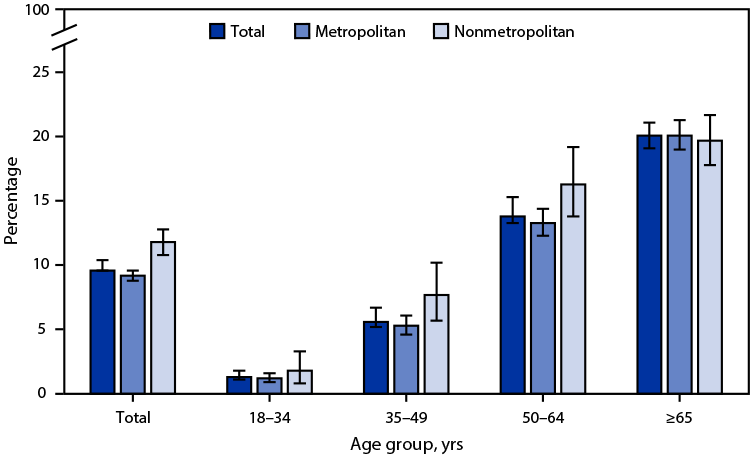
In 2022, 9.6% of adults aged ≥18 years had diagnosed diabetes, with the percentage lower among adults living in metropolitan areas (9.2%) compared with adults in nonmetropolitan areas (11.8%). The prevalence of diagnosed diabetes was lower in metropolitan areas only among those aged 35–49 years (5.3% versus 7.7%) and aged 50–64 years (13.3% versus 16.3%). Read More >
Posted on byQuickStats: Rate of Triplet and Higher-Order Multiple Births by Age of Mother — National Vital Statistics System, United States, 1998 and 2022
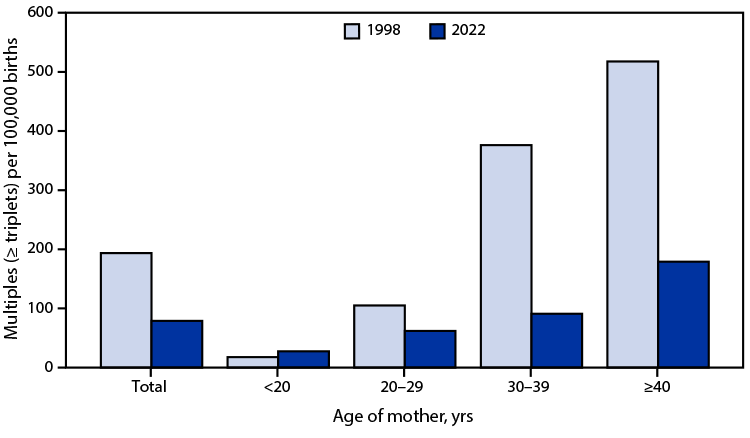
The triplet and higher-order multiple birth rate declined from an all-time high of 193.5 per 100,000 total births in 1998 to 78.9 in 2022. From 1998 to 2022, triplet and higher-order birth rates increased among mothers aged <20 years (from 17.6 to 27.5) but declined among mothers aged ≥20 years. In both 1998 and 2022, Read More >
Posted on byQuickStats: Average Number of Stroke Deaths per Day, by Month and Sex — National Vital Statistics System, United States, 2021
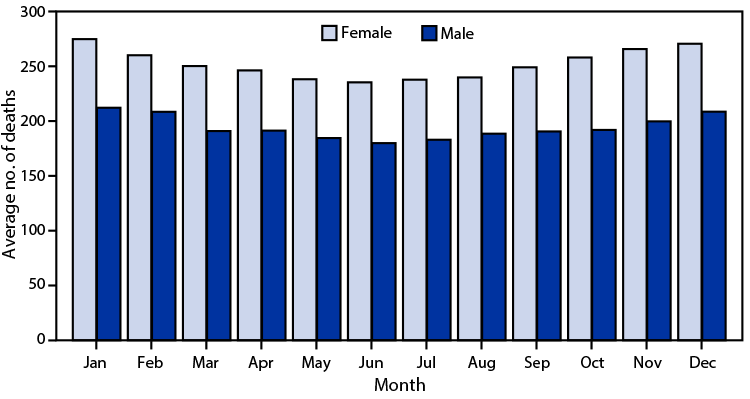
In 2021, the average number of stroke deaths per day was highest in January (275 for females and 212 for males) and then declined to a monthly low in June (235 for females and 180 for males). Beginning in July, the average number of stroke deaths per day increased for each successive month through the Read More >
Posted on byQuickStats: Age-Adjusted Percentage of Adults Aged ≥18 Years Who Received an Influenza Vaccination During the Past 12 Months, by Sex and Race and Ethnicity — National Health Interview Survey, United States, 2022
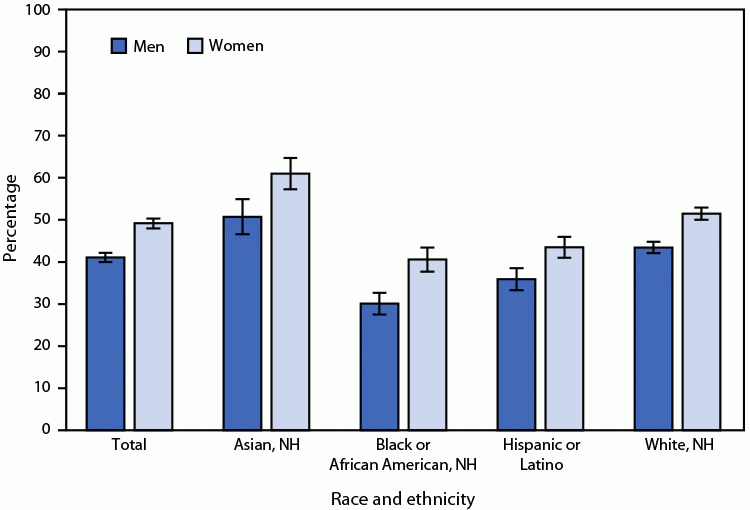
In 2022, among persons aged ≥18 years, women were more likely than were men (49.2% versus 41.1%) to have received an influenza vaccination during the past 12 months. Women were more likely than were men to have received an influenza vaccination among Asian (61.0% versus 50.7%), Black (40.6% versus 30.1%), Hispanic (43.5% versus 35.9%), and Read More >
Posted on byLife Expectancy Increases, However Suicides Up in 2022
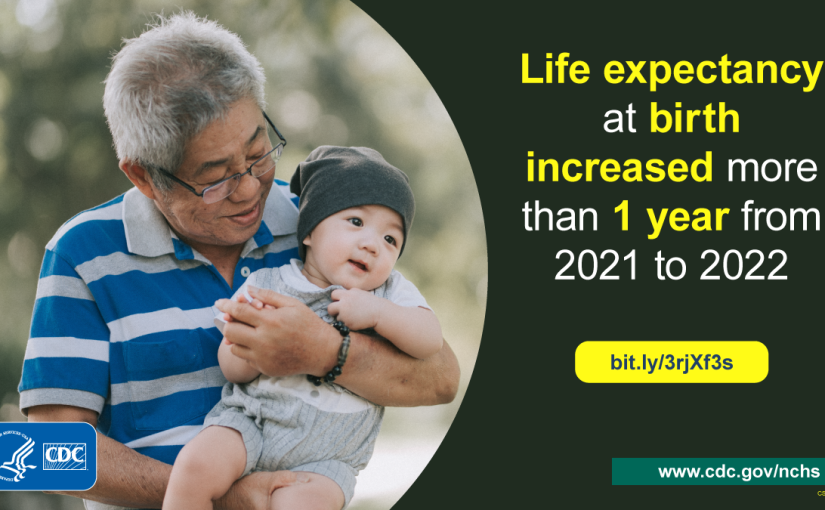
CDC’s National Center for Health Statistics released two reports today examining provisional mortality data from 2022. While analysis shows the number and rate of suicides increased for the second year in a row from, overall life expectancy at birth increased by just over a year. This increase regains some of the 2.4 years of life Read More >
Posted on byQuickStats: Percentage of Adults Aged ≥18 Years Who Rarely or Never Get the Social and Emotional Support They Need, by Sex and Disability Status — National Health Interview Survey, United States, 2021
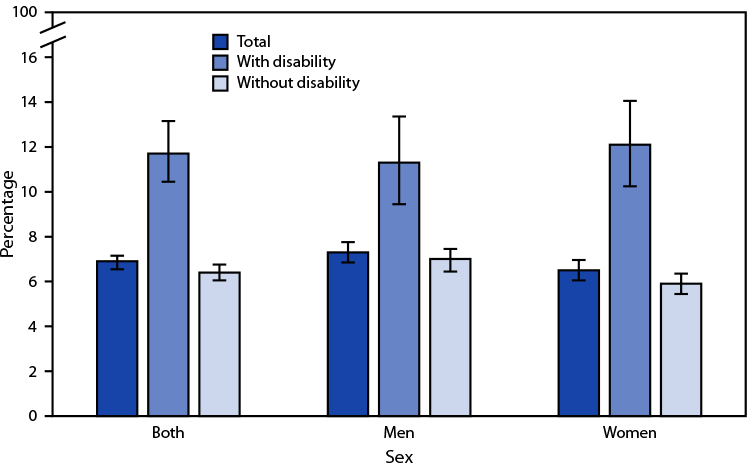
In 2021, 6.9% of adults aged ≥18 years rarely or never got the social and emotional support they needed. Overall, the percentage was higher among those with a disability (11.7%) than among those without disability (6.4%). Among men, 11.3% of those with disability rarely or never got needed support, compared with 7.0% of those without Read More >
Posted on by
