NCHS: A Blog of the National Center for Health Statistics
NCHS Data Query System Launches New Features
The National Center for Health Statistics (NCHS) released new features and enhancements to its Data Query System (DQS). DQS, originally launched in spring of 2024, is an online query and visualization tool that compiles statistics from more than 150 health topics into one easily searchable resource. DQS helps you access thousands of health estimates from Read More >
Posted on byHow Much Fast Food Do We Eat in America?

Eating fast food is often the focus of public health conversations, particularly the role fast food may play in healthy eating habits and health outcomes. Two new reports from the National Health and Nutrition Examination Survey (NHANES) provide insight about how much fast-food U.S. adults and youth are eating. These reports rely on data from Read More >
Posted on byThe Rising Age of Motherhood in the United States
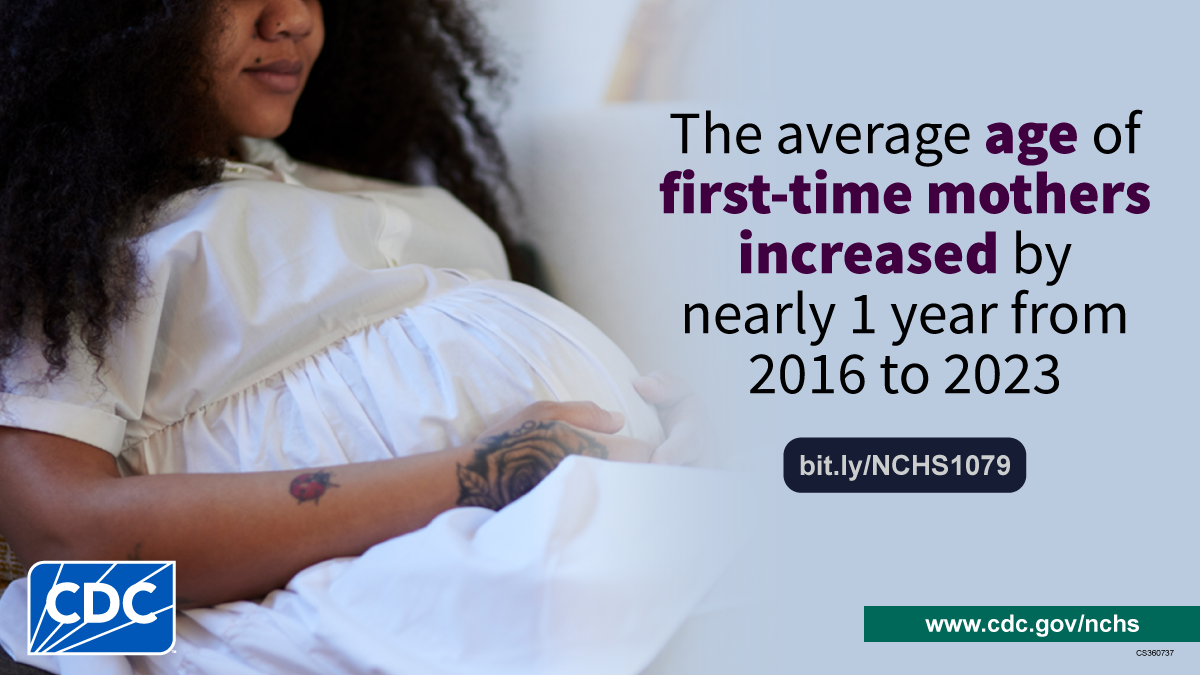
Women in the United States are having children later in life. A new report, “Trends in Mean Age of Mothers in the United States, 2016 to 2023,” reveals that the average age of first-time mothers has increased from 26.6 years in 2016 to 27.5 years in 2023. This trend isn’t limited to first-time moms; the average age Read More >
Posted on byNew Methods Help Fill Health Data Gaps while Protecting Privacy

Innovative Statistical Strategies Provide “Synthetic” Data Developed from Survey Participant Responses NCHS researchers compare methods for developing synthetic data for complex surveys, highlighting one that strikes the ideal balance between data usefulness and privacy protection. When you fill out a health survey or provide personal information at a medical visit, you probably trust that your Read More >
Posted on byQuickStats: Mental Health Treatment Trends Among Adults Aged ≥18 Years, by Age Group — United States, 2019–2023
From 2019 to 2023, the percentage of adults who had received any mental health treatment during the past 12 months increased from 19.2% to 23.9%. This pattern was similar among adults aged 18–44 and 45–64 years. No significant change was observed among adults aged ≥65 years. Supplementary Table: https://stacks.cdc.gov/view/cdc/174552 Source: National Center for Health Statistics, National Health Read More >
Posted on byNew Reports Confirm U.S. Life Expectancy Increased while Drug Overdose Deaths Decreased in 2023
U.S. life expectancy increased in 2023, reaching its highest level since the COVID-19 pandemic, according to final mortality data released today. The data are featured in two new reports from CDC’s National Center for Health Statistics (NCHS). “Mortality in the United States: 2023” is the first public release of final mortality data for 2023. The Read More >
Posted on byQuickStats: Age-Adjusted Percentage of Adults Aged ≥18 Years with Diagnosed Chronic Obstructive Pulmonary Disease, by Urbanization Level — United States, 2023
In 2023, the age-adjusted percentage of adults aged ≥18 years with diagnosed chronic obstructive pulmonary disease (COPD) was 3.8%. The prevalence of COPD among adults increased as urbanization level decreased. Supplementary Table: https://stacks.cdc.gov/view/cdc/168877 Source: National Center for Health Statistics, National Health Interview Survey, 2023. https://www.cdc.gov/nchs/nhis.htm https://www.cdc.gov/mmwr/volumes/73/wr/mm7346a5.htm Read More >
Posted on byNCHS Recognizes National Rural Health Day

Each year, we celebrate National Rural Health Day on the third Thursday of November. One in five people in the United States live in rural areas. Many of these residents face unique challenges that can affect health, such as higher poverty rates and less access to care. National Rural Health Day reminds us of the Read More >
Posted on byQuickStats: Percentage of Adults Aged ≥18 Years Who Were in Families Having Problems Paying Medical Bills in the Past 12 Months, by Disability Status and Age Group — United States, 2023
In 2023, the percentage of adults aged ≥18 years who were in families having problems paying medical bills in the past 12 months was higher among those with disabilities (21.2%) compared with those without disabilities (9.6%). This pattern was observed across all age groups. Supplementary Table: https://stacks.cdc.gov/view/cdc/164154 Source: National Center for Health Statistics, National Health Interview Read More >
Posted on byQuickStats: Prevalence of Obesity and Severe Obesity Among Persons Aged 2–19 Years — United States, 1999–2000 Through 2021–2023
From 1999–2000 through August 2021–August 2023, the prevalence of obesity among persons in the United States aged 2–19 years increased from 13.9% to 21.1%, and the prevalence of severe obesity increased from 3.6% to 7.0%. Supplementary Table: https://stacks.cdc.gov/view/cdc/164014 Source: National Center for Health Statistics, National Health and Nutrition Examination Survey, 1999–2000 through August 2021–August 2023. https://www.cdc.gov/nchs/nhanes/index.htm https://www.cdc.gov/mmwr/volumes/73/wr/mm7341a5.htm Read More >
Posted on byNHANES August 2021–August 2023 Data Released with Obesity Report
CDC’s National Center for Health Statistics recently released its first wave of data files from the August 2021-August 2023 cycle of the National Health And Nutrition Examination Survey (NHANES). NCHS also published the first report analyzing these data. The report, Obesity and Severe Obesity Prevalence in Adults: United States, August 2021–August 2023, describes recent trends Read More >
Posted on byQuickStats: Rates of Emergency Department Visits for Children and Adolescents with Acute Upper Respiratory Infection, by Age Group — United States, 2021–2022
In 2021–2022, the rate for emergency department (ED) visits for children and adolescents with acute upper respiratory infection was 38.6 per 1,000 persons aged <18 years. The ED visit rate was highest for infants aged <1 year (120.5) and decreased by age, with the lowest rate among adolescents aged 12–17 years (14.4). Supplementary Table: https://stacks.cdc.gov/view/cdc/162215 Source: Read More >
Posted on byQuickStats: Percentage of Suicides and Homicides Involving a Firearm Among Persons Aged ≥10 Years, by Age Group — United States, 2022
In 2022, among persons aged ≥10 years, the percentage of suicide deaths involving a firearm was lowest among persons aged 25–44 years (47.4%) and highest among persons aged ≥65 years (70.6%). The percentage of homicide deaths that involved a firearm was highest among persons aged 10–24 years and then decreased with age, from 92.2% among Read More >
Posted on byeMKF: A New Tool for Studying Small Populations
Statisticians at the National Center for Health Statistics recently developed a tool to help with the challenge of producing estimates of health conditions and other indicators of health for groups of people that may be less represented in the population. The challenge of studying small populations For researchers who study small populations , measuring health Read More >
Posted on byDiscover the Latest Additions to NCHS’ Data Query System
CDC’s National Center for Health Statistics has added more data to our Data Query System (DQS). This tool makes health data easier to find and use. Explore data about more than 120 health topics from multiple national data sources in DQS. Use the system to find national estimates, visualize public health trends, and download formatted Read More >
Posted on byNew Information Available from Health, United States
The National Center for Health Statistics (NCHS) recently released new topic summaries on hypertension, prescription drug use, and availability of dentists as part of Health, United States. Additionally, new information was added to data tables on a variety of health topics already available on the Health, United States website. Health, United States integrates data from Read More >
Posted on byQuickStats: Percentage of Children and Adolescents Aged ≤17 Years Who Used Telemedicine During the Past 12 Months, by Age Group and Year — United States, 2021–2023
The percentage of children and adolescents aged 0–17 years using telemedicine during the past 12 months declined from 18.3% in 2021 to 14.2% in 2023. Telemedicine use declined across all three age groups during this period. In both 2022 and 2023, telemedicine use increased with age. Supplementary Table: https://stacks.cdc.gov/view/cdc/159160 Source: National Center for Health Statistics, National Health Read More >
Posted on byQuickStats: Percentage of Adult Day Services Centers That Use Any Telehealth, by U.S. Census Bureau Region — United States, 2022
In 2022, 46% of U.S. adult day services centers used any telehealth tools. Approximately one half of centers in the Northeast and West used any telehealth, compared with approximately one third of centers in the Midwest and South. Supplementary Table: https://stacks.cdc.gov/view/cdc/157543 Source: National Center for Health Statistics, National Post-Acute and Long-Term Care Study, 2022. https://www.cdc.gov/nchs/npals https://www.cdc.gov/mmwr/volumes/73/wr/mm7330a4.htm Read More >
Posted on byNew Interactive Dashboard and Data File Feature Health Center Data
Two new developments provide more access to data on visits to health centers in the United States. The National Center for Health Statistics’s (NCHS) Division of Health Care Statistics recently launched an interactive dashboard and released a public use data file from the National Ambulatory Medical Care Survey (NAMCS). These resources feature data collected in Read More >
Posted on byDiscovering Teen Health Insights with the CDC’s NHIS-Teen Survey
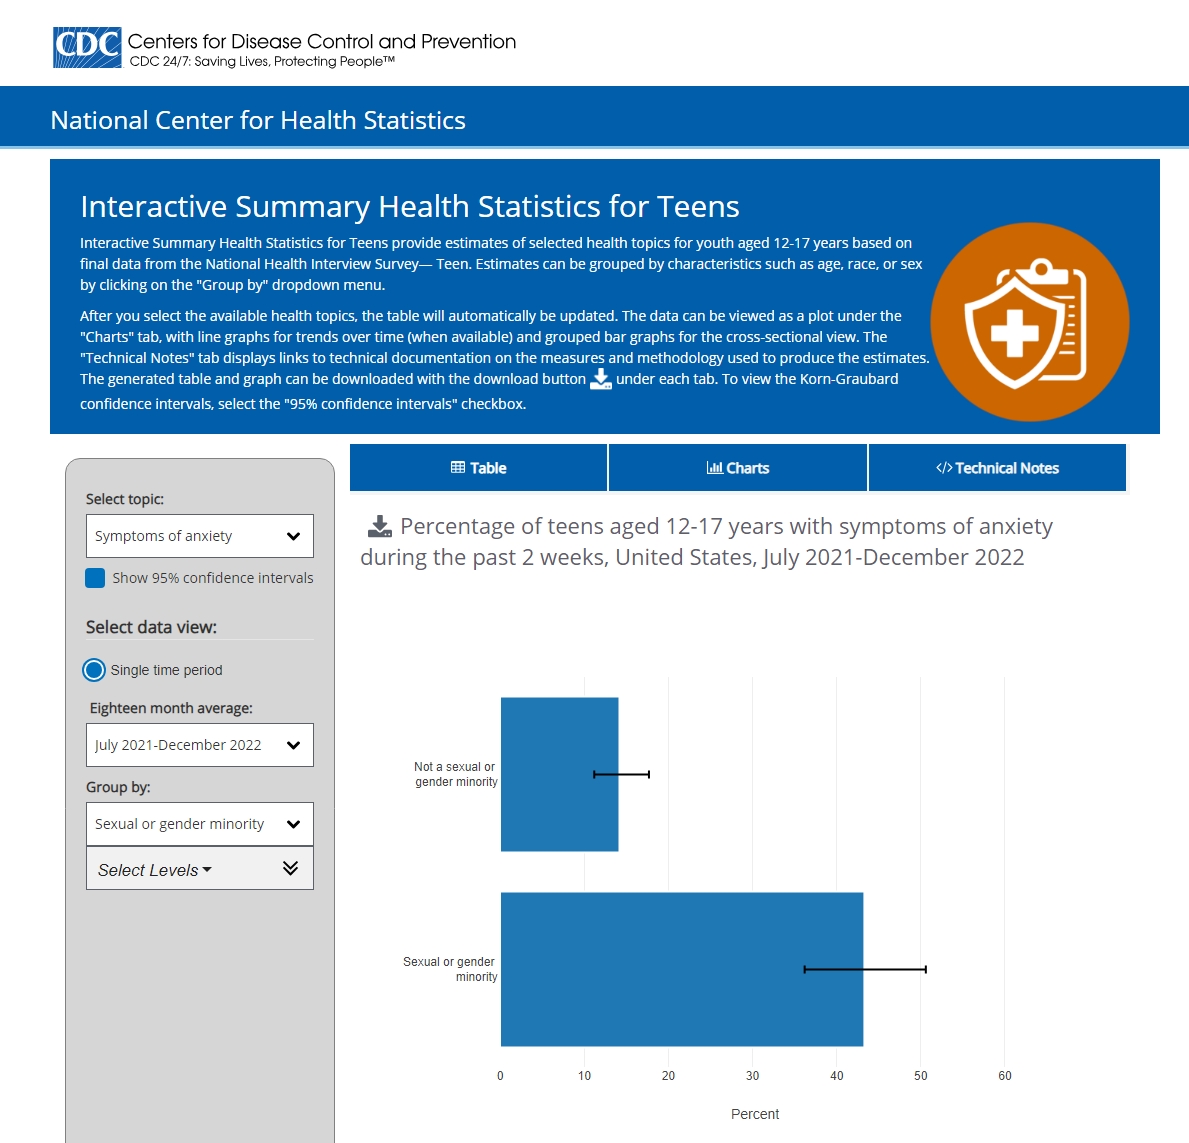
With the release of the new report Perceived Social and Emotional Support Among Teenagers: United States, July 2021 – December 2022 from CDC’s National Center for Health Statistics, an important finding stands out: Parents often report that their teens receive higher levels of social and emotional support compared to what the teens report. The findings Read More >
Posted on byHear About NCHS Research at the 2024 Academy Health Annual Research Meeting
NCHS has several presentations and poster sessions at the 2024 Academy Health Annual Research Meeting from June 29 to July 2 at the Baltimore Convention Center. Highlights include: Sunday, June 30 8:00 a.m. – 9:15 a.m. (Halls A-B, Level 100) The session, The Experience of Physicians Who Use Telemedicine Technology: United States, 2021, will provide Read More >
Posted on byQuickStats: Percentage of Current Cigarette Smokers Aged ≥18 Years Who Received Advice from a Health Professional To Quit Smoking, by Sex and Age Group — United States, 2022
In 2022, 42.0% of current cigarette smokers aged ≥18 years received advice from a doctor, dentist, or other health professional about ways to quit smoking. The percentage of current smokers who received advice to quit smoking increased with age. Overall, and for current smokers aged 18–44 years, men were less likely to receive advice on Read More >
Posted on byU.S. Uninsured Rate Drops by 26% Since 2019
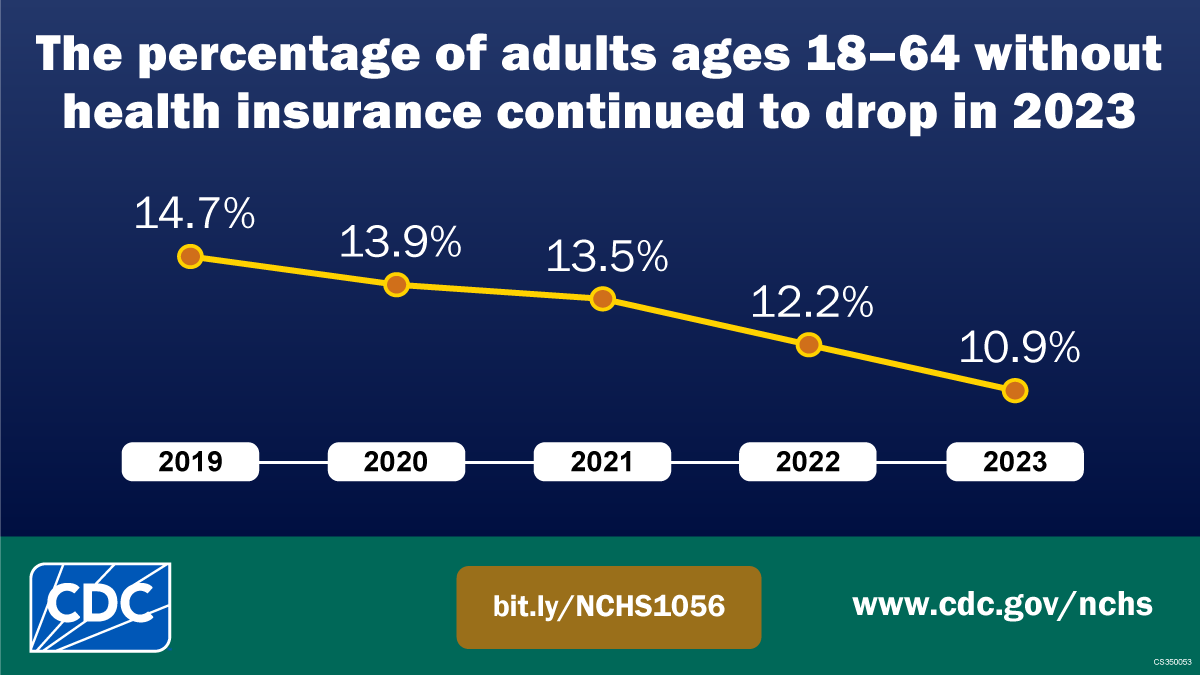
The overall number of Americans without health insurance dropped by 8.2 million from 2019 to 2023. These findings are included in a new report by the CDC’s National Center for Health Statistics (NCHS). The findings are featured in the report, “Health Insurance Coverage: Early Release of Estimates from the National Health Interview Survey, 2023.” It Read More >
Posted on byQuickStats: Percentage of Adults Aged ≥25 Years Who Met the 2018 Federal Physical Activity Guidelines for Both Muscle-Strengthening and Aerobic Physical Activity, by Educational Attainment — United States, 2022
In 2022, 22.5% of adults met federal guidelines for both muscle-strengthening and aerobic physical activity. The percentage of adults who met these guidelines increased with increasing educational attainment, from 12.2% among adults who completed high school or less to 33.6% among those with a bachelor’s degree or higher. Supplementary Table: https://stacks.cdc.gov/view/cdc/155046 Source: National Center for Health Statistics, Read More >
Posted on byQuickStats: Percentage Distribution of Deaths Involving Injuries from Recreational and Nonrecreational Use of Watercraft, by Month — United States, 2020–2022
During 2020–2022, a total of 1,481 deaths occurred involving injuries from recreational and nonrecreational use of watercraft. The highest percentage of these deaths (17.4%) occurred in July, with the majority occurring during May–September. Supplementary Table: https://stacks.cdc.gov/view/cdc/155045 Source: National Center for Health Statistics, National Vital Statistics System, Mortality Data, 2020–2022. https://www.cdc.gov/nchs/nvss/deaths.htm Read More >
Posted on by