Motor Vehicle Traffic Death Rates Among Adolescents and Young Adults Aged 15–24, by Urbanicity: United States, 2000–2018
Posted on by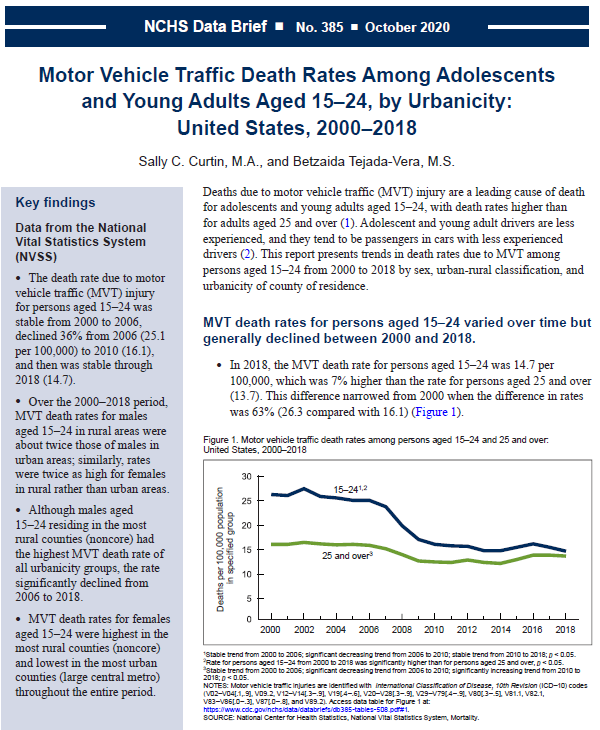 Questions for Sally Curtin, Health Statistician and Lead Author of “Motor Vehicle Traffic Death Rates Among Adolescents and Young Adults Aged 15–24, by Urbanicity: United States, 2000–2018.”
Q: Was there a specific finding in the data that surprised you from this report?
SC: The finding that the difference in MVT death rates between persons aged 15-24 and 25 years and over has narrowed so much since 2000 so that the rate is only 7% higher for 15-24 year-olds in 2018.
Q: How did you obtain this data for this report?
SC: These data are from the National Vital Statistics System and come from the information from death certificates in the United States. All of the rates in this report are reproducible from the CDC WONDER online database.
Q: How do you classify urban and rural areas?
SC: The National Center for Health Statistics developed a scheme (the latest published in 2013) to classify the urbanicity of counties by combining information on whether the county was considered to be part of a metropolitan area and the population of the county. Based on this, there are four categories of Metropolitan (urban) counties, from largest to smallest, and two categories of rural counties.
Q: Is this the first report on motor vehicle deaths with an urban and rural breakdown? Is there any trend data that goes back further than 2000?
SC: A recent NCHS report examined trends in MVT deaths by urban-rural classification but it was for all ages combined. This is the first report to focus on trends in younger adults, aged 15-24, by urban-rural.
There is MVT trends data prior to 2000, although they are not entirely comparable to the data from 1999 to the present. However, trends from 1980-1999 rates are generally downward.
Q: What is the take home message for this report?
SC: There has been great progress in reducing death rates to young adults aged 15-24, for whom this has been a leading cause of death. However, the disparity in rates that still exist between rural and urban counties shows that there is more work to be done, particularly in the most rural areas.
Posted on by