Q & A with Author: Rural-urban Differences in Unintentional Injury Death Rates Among Children Aged 0-17: United States, 2018-2019
Posted on by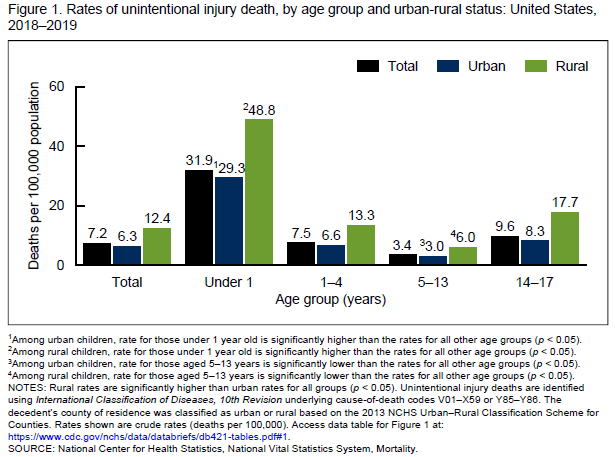 Questions for Matthew Garnett, Health Statistician and Lead Author of “Rural-urban Differences in Unintentional Injury Death Rates Among Children Aged 0-17: United States, 2018-2019.”
Q: Can you describe what unintentional injury deaths are?
MG: Unintentional injury deaths include fatal injuries that were unintended, unplanned, and did not occur on purpose. In contrast, intentional injuries include homicide or assault and suicide or self-harm. Unintentional injury deaths include a wide array of mechanisms, with the four most common being: poisoning, motor vehicle crashes, drowning, and falls.
Q: How did the data vary by age groups?
MG: Rates of unintentional injury deaths differ across age groups. In both urban and rural areas, unintentional injury death rates were highest among children aged under 1 year, followed by a decline in the 1–4 and 5–13 age groups, and then increasing in the 14–17 group. Although this pattern was seen in both urban and rural areas, rural rates were consistently higher than urban rates for all age groups.
The high rates experienced among children under the age of 1 year were driven by high rates of suffocation (includes choking, asphyxiation, and strangulation). Among children aged 1-4 years, the leading mechanisms diverged based on urban-rural status, with drowning being the leading mechanism in urban areas, and with both drowning and motor vehicle traffic being the leading mechanism among in rural areas. In the older age groups, including those aged 5-13 and 14-17, motor vehicle traffic was the leading mechanism.
The decrease in overall rates from the under 1 year group to the 1-4 age group can be explained by a lower suffocation rates, which decreased from 24.9 in urban areas and 42.1 in rural areas among children under 1, to 0.7 and 1.1, respectively, in the 1-4 age group. The increase in overall rates between the 5-13 and 14-17 age groups is partially due to the increase in motor vehicle traffic rates, which increased from 1.5 in urban areas and 3.1 in rural areas among the 3-13 age group to 5.1 and 12.5, respectively, in the 14-17 age group.
Q: Do you have trend data that goes further back than 2018?
MG: This information is not presented in the report, but additional national data is available through CDC’s query system – CDC WONDER. Since 1999, rates of unintentional injury death among children aged 0-17 years have decreased from a high of 12.7 (per 100,000 population) in 1999 to 7.2 in 2019, a 43% decrease. Decreases were seen both in urban and rural areas. In urban areas the rate decreased from 11.0 in 1999 to 6.4 in 2019, a 42% decrease. In rural areas, the rate decreased from 21.5 in 1999 to 12.7 in 2019, a decrease of 41%. The unintentional injury death rate has decreased among children in both areas between 1999 and 2019; however, the gap between urban and rural rates has been maintained over time.
Rates of Unintentional Injury Death Among Children Aged 0-17 Years by Urban-rural Status, United States, 1999-2019
|
Year |
Total Rate per 100,000 |
Urban Rate per 100,000 |
Rural Rate per 100,000 |
|
1999 |
12.7 |
11.0 |
21.5 |
|
2000 |
12.3 |
10.7 |
21.1 |
|
2001 |
11.9 |
10.4 |
20.3 |
|
2002 |
11.9 |
10.6 |
19.7 |
|
2003 |
11.5 |
10.0 |
20.2 |
|
2004 |
11.7 |
10.2 |
20.3 |
|
2005 |
11.1 |
9.7 |
19.4 |
|
2006 |
10.8 |
9.4 |
18.6 |
|
2007 |
10.7 |
9.5 |
17.6 |
|
2008 |
9.3 |
8.1 |
16.6 |
|
2009 |
8.6 |
7.5 |
14.9 |
|
2010 |
8.1 |
7.0 |
14.4 |
|
2011 |
8.0 |
6.9 |
14.2 |
|
2012 |
7.7 |
6.7 |
13.8 |
|
2013 |
7.4 |
6.4 |
13.2 |
|
2014 |
7.2 |
6.3 |
12.9 |
|
2015 |
7.6 |
6.7 |
13.6 |
|
2016 |
7.8 |
7.0 |
13.2 |
|
2017 |
7.7 |
6.8 |
13.4 |
|
2018 |
7.1 |
6.3 |
12.2 |
|
2019 |
7.2 |
6.4 |
12.7 |
NOTES: Unintentional injury deaths are identified using International Classification of Diseases, 10th Revision underlying cause-of-death codes V01–X59 or Y85–Y86. The decedent’s county of residence was classified as urban or rural based on the 2013 NCHS Urban–Rural Classification Scheme for Counties. Rates shown are crude rates (deaths per 100,000).
SOURCE: National Center for Health Statistics, National Vital Statistics System, Mortality.
Q: What is the main takeaway message here?
MG: There are two main takeaways here. The first is that when discussing unintentional injury deaths, there are disparities for children between urban and rural areas. These disparities are found across age groups, and across multiple injury mechanisms.
The second takeaway is that the reasons for unintentional injury deaths change with age. Among the youngest children, under 1 year of age, suffocation is the leading mechanism of death, with the highest rate of any mechanism for both urban and rural children across all age groups. Among slightly older children aged 1-4 years, the leading mechanism becomes motor vehicle traffic and drowning. After this age group, the mechanism with the highest rates is motor vehicle traffic for children aged 5-13 and 14-17. For all of these leading mechanisms, rates were higher for children in rural areas.
Q: What are the reasons why unintentional injury death rates are higher in rural vs. urban areas?
MG: Data from this report suggests that different mechanisms drive the overall unintentional injury rate for each age group. Urban-rural disparities between mechanisms provide insight into the larger disparities seen in the overall unintentional rates. For example, among children under the age of 1, the rural rate of deaths involving suffocation were significantly higher (42.1 per 100,000 population) than urban rates (24.9). For that age group, suffocation was a major driver of disparity seen in the total unintentional injury death rate, which was 48.8 for rural areas and 29.3 for urban areas.
Among children aged 1-4, all reportable mechanisms show significantly higher rates among children in rural areas compared to children in urban areas. For some mechanisms, these disparities are smaller, such as natural or environmental deaths where the rural rate was 0.5 compared to the urban rate of 0.3. In other mechanisms the disparity is larger, such as for deaths involving fire or flames, where the rural rate was 1.7 compared to the urban rate of 0.4, more than 4 times higher.
Among children aged 5-13 and 14-17, not all mechanisms show a significant disparity. However, some of the largest drivers of the overall unintentional death rate (that is, mechanisms with a larger number of deaths) for each group did. For example, motor vehicle traffic death rates were twice as high in rural areas compared to urban areas for both age groups.
This data brief does not get into the specific reasons for disparities within specific mechanisms. However, there is a wide body of research that has associated urban-rural differences in injury mortality to a variety of factors. These include differences in types of activities undertaken by children living in rural and urban areas and the built environments that they undertake these activities in. Studies have also suggested that differences in patterns of safety equipment use and the practice of safety-related behaviors may play a role in differing mortality rates. Access to care has also been pointed to as an issue, when considering first responder response times in rural settings compared to urban settings, and access to medical facilities, including high level trauma care. The introduction to the report cites several of these studies.
Additional information on unintentional injuries, and strategies to address unintentional injuries are available from the CDC’s National Center for Injury Prevention and Control.
Posted on by