Category: MMWR
QuickStats: Percentage of Children and Adolescents Aged ≤17 Years Who Have Experienced a Specified Stressful Life Event, by Type of Event and Family Income — National Health Interview Survey, United States, 2021
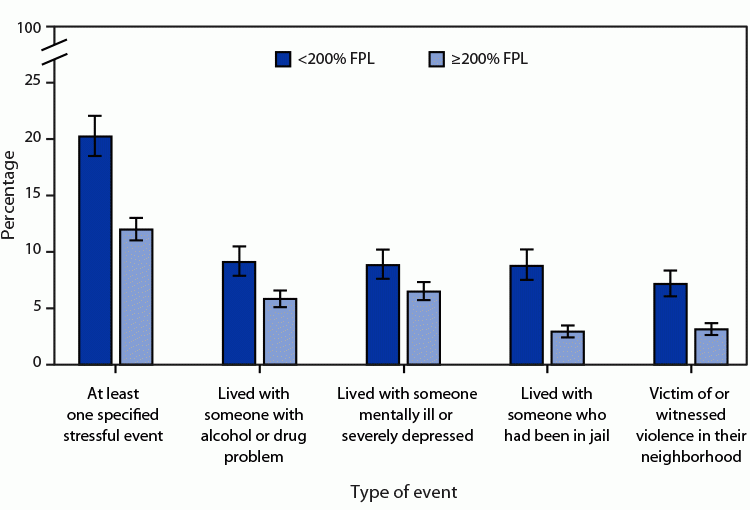
In 2021, 20.2% of children and adolescents in families with incomes <200% of FPL and 12.0% of those in families with incomes ≥200% of FPL had experienced at least one specified stressful life event. Children and adolescents in families with incomes <200% of FPL were more likely than those in families with incomes ≥200% of Read More >
Posted on byQuickStats: Age-Adjusted Percentage of Adults Aged 50–75 Years Who Received the Recommended Colorectal Cancer Screening, by Sex and Family Income
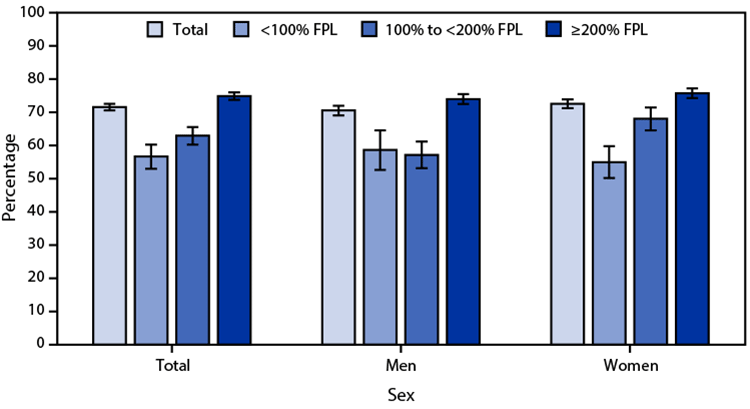
In 2021, 71.6% of adults aged 50–75 years reported they received the recommended colorectal cancer screening, with the percentage increasing with income from 56.7% for those with family incomes <100% of FPL to 63.0% for those with family incomes 100% to <200% of FPL, and 74.9% for those with family incomes ≥200% of FPL. The Read More >
Posted on byQuickStats: Age-Adjusted Death Rates, for Pedestrians Involved in a Collision with a Motor Vehicle, by Race and Hispanic Origin — National Vital Statistics System, United States, 2021
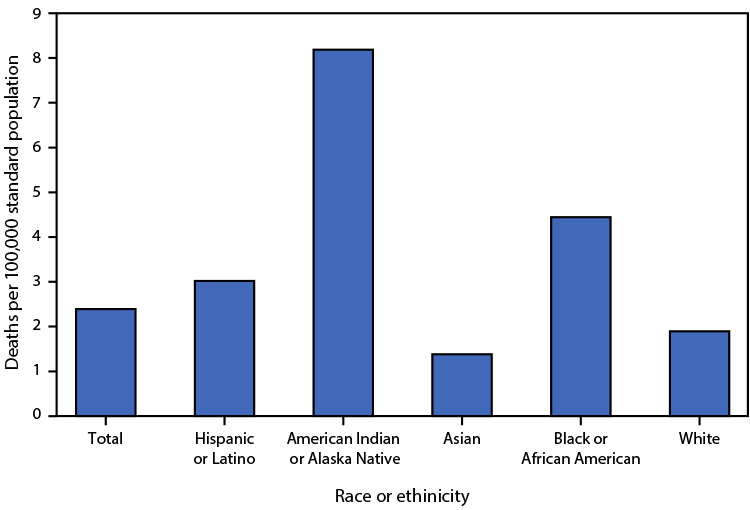
In 2021, a total of 8,392 deaths from pedestrian-involved collisions with motor vehicles occurred. The age-adjusted death rate from such collisions was highest for American Indian or Alaska Native persons (8.2 deaths per 100,000 standard population), followed by Black or African American (4.4), Hispanic or Latino (3.0), White (1.9), and Asian (1.4) persons. Source: National Vital Read More >
Posted on byQuickStats: Percentage of Adults Aged ≥18 Years Who Received Care at Home from a Friend or Family Member During the Past 12 Months, by Age Group — National Health Interview Survey
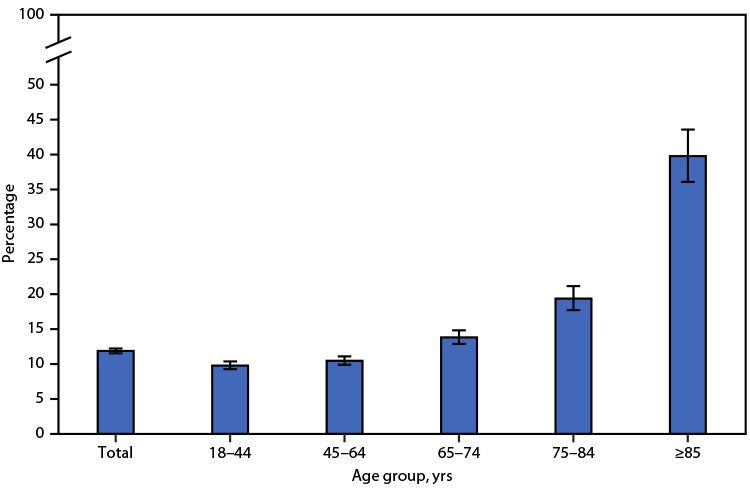
During 2021, 11.9% of adults aged ≥18 years received care at home from a friend or family member during the past 12 months. The percentage of adults who received care during the past 12 months was similar among adults aged 18–44 years (9.8%) and 45–64 years (10.5%), then increased with age to 13.8% among those Read More >
Posted on byQuickStats: Percentage of Adults Aged ≥18 Years Who Have Been Bothered a Lot by Headache or Migraine in the Past 3 Months, by Sex and Age Group — National Health Interview Survey, 2021
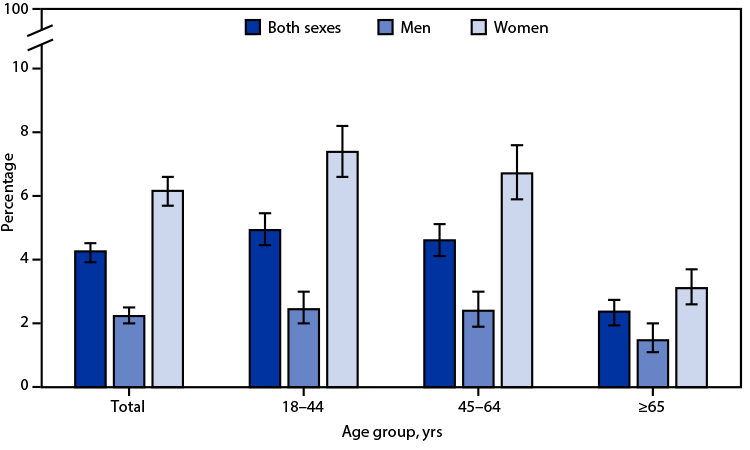
In 2021, 4.3% of adults aged ≥18 years reported being bothered a lot by headache or migraine in the past 3 months with the percentage among women (6.2%) higher than that among men (2.2%). Percentages were higher among women than men in all age groups: 7.4% versus 2.5% in adults aged 18–44 years, 6.7% versus Read More >
Posted on byQuickStats: Age-Adjusted Percentage of Adults Aged ≥18 Years Who Take Prescription Medication for Depression, by Sex and Race and Hispanic Origin — National Health Interview Survey, United States, 2021
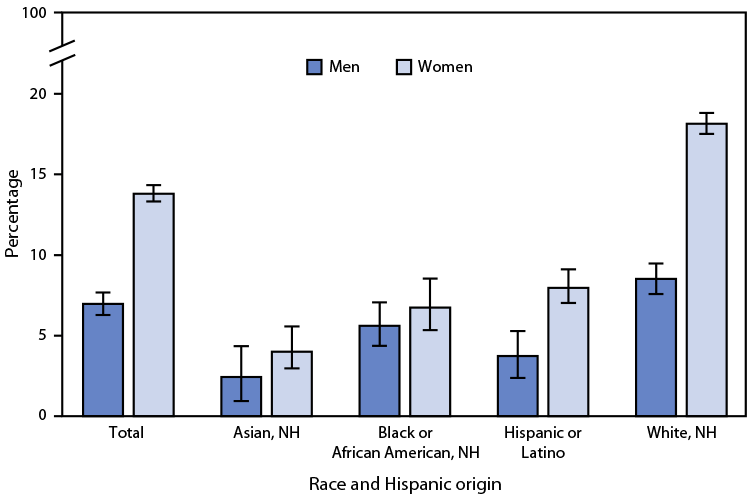
In 2021, among adults aged ≥18 years, women were more likely to take prescription medication for depression than were men (13.8% versus 7%). This pattern was found among non-Hispanic White (White) (18.1% versus 8.5%) and Hispanic or Latino (8.0% versus 3.7%) adults, but differences by sex were not statistically significant among non-Hispanic Black or African Read More >
Posted on byQuickStats: Age-Adjusted Percentage of Adults Aged ≥18 Years Who Had a Repetitive Strain Injury During the Past 3 Months, by Sex and Race and Hispanic Origin
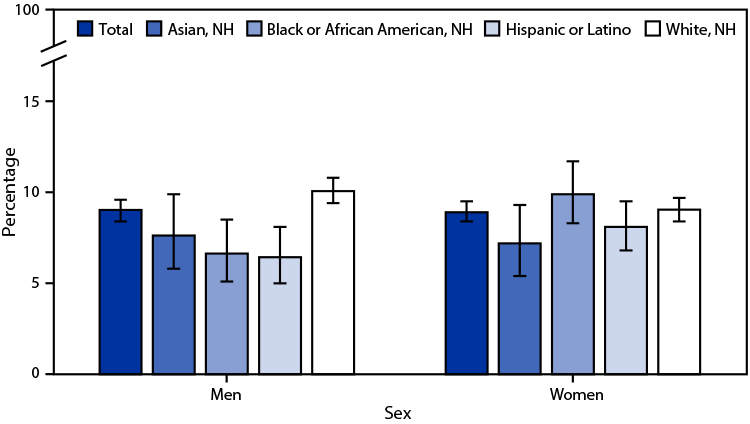
In 2021, 9.0% of men and 8.9% of women aged ≥18 years had a repetitive strain injury during the past 3 months. Non-Hispanic White men (10.1%) were more likely to have a repetitive strain injury than were non-Hispanic Asian (Asian) (7.6%), non-Hispanic Black or African American (Black) (6.6%), and Hispanic or Latino (Hispanic) (6.4%) men. Read More >
Posted on byQuickStats: Percentage of Currently Employed Adults Aged ≥18 Years Who Have Paid Sick Leave by Education Level — National Health Interview Survey, 2021
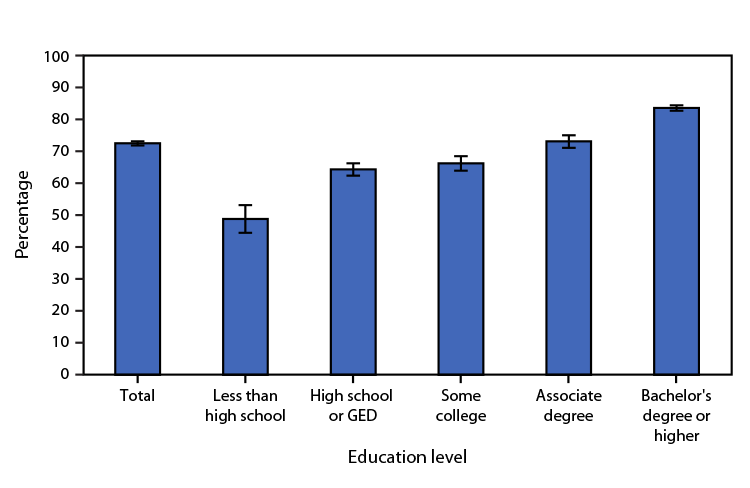
In 2021, 72.5% of employed adults had paid sick leave. The percentage with sick leave was highest among workers with a bachelor’s degree or higher (83.6%), followed by workers with an associate degree (73.2%). The percentage of sick leave was similar for workers with some college (66.3%) and those with a high school diploma or Read More >
Posted on byQuickStats: Percentage of Adults Who Were in Families Having Problems Paying Medical Bills During the Previous 12 Months, by Race and Selected Hispanic Origin Subgroups — National Health Interview Survey, United States, 2020−2021
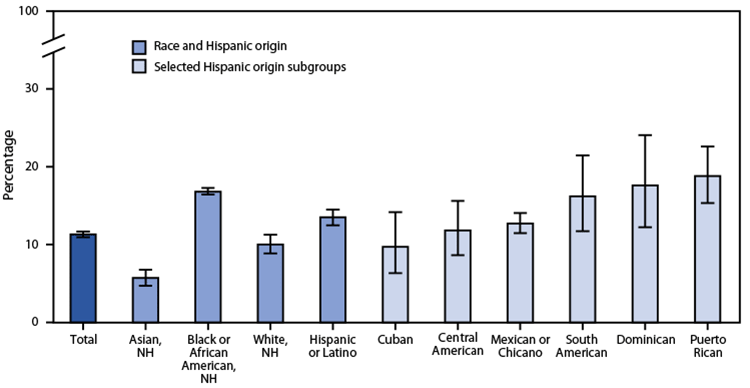
During 2020–2021, the percentage of U.S. adults who were in families having problems paying medical bills during the previous 12 months was 11.3%. Non-Hispanic Black or African American adults (16.8%) were most likely to be in families having problems paying medical bills followed by Hispanic or Latino (13.5%), non-Hispanic White (10.0%), and non-Hispanic Asian (5.7%) Read More >
Posted on byQuickStats: Age-Adjusted Percentage of Adults Aged ≥18 Years with Serious Psychological Distress During the Past 30 Days, by Family Income — National Health Interview Survey, 2021
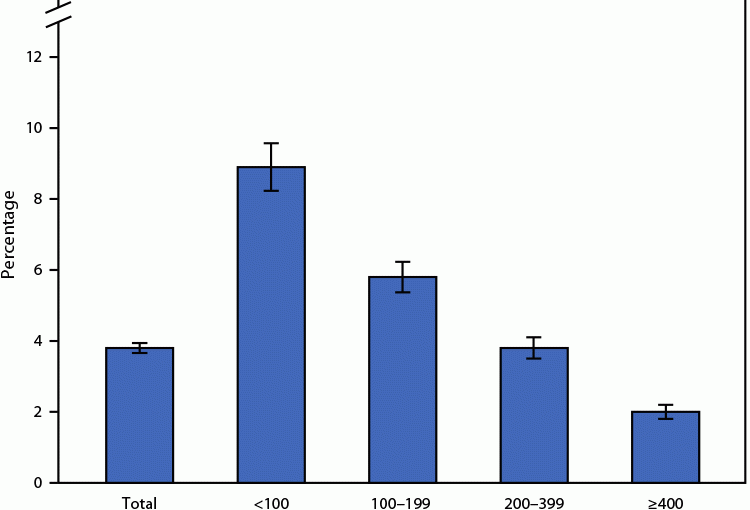
In 2021, 3.8% of adults aged ≥18 years had serious psychological distress during the past 30 days. The age-adjusted percentage of adults who had serious psychological distress decreased with increasing family income, from 8.9% of adults with family income <100% of FPL, to 5.8% of adults with family income 100%–199% of FPL, to 3.8% of Read More >
Posted on byQuickStats: Percentage Distribution of Cigarette Smoking Status Among Current Adult E-Cigarette Users, by Age Group — National Health Interview Survey, United States, 2021
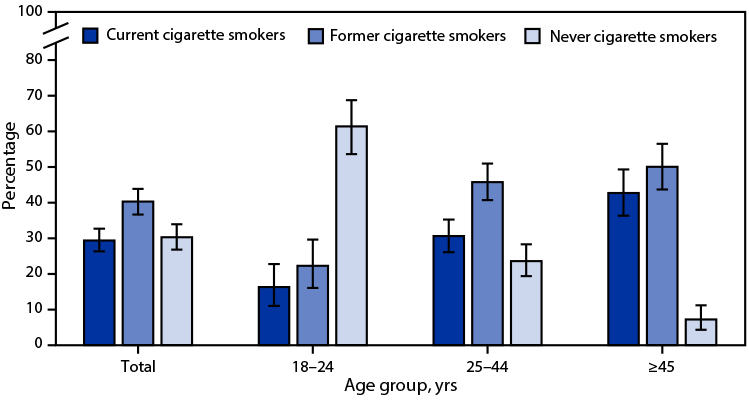
In 2021, 4.5% of U.S. adults were current e-cigarette users. Among adult e-cigarette users overall, 29.4% also were current cigarette smokers, 40.3% were former cigarette smokers, and 30.3% had never been cigarette smokers. Among e-cigarette users aged 18–24 years, 16.3% were current smokers, 22.3% were former smokers, and 61.4% had never been cigarette smokers. Among Read More >
Posted on byQuickStats: Percentage of Adults Aged 18–64 Years Who Used Telemedicine in the Past 12 Months, by Sex and Health Insurance Coverage — National Health Interview Survey, United States 2021
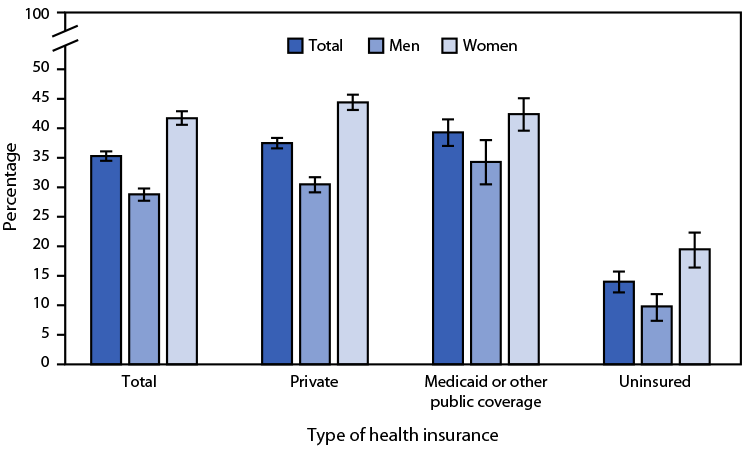
Overall, in 2021, 35.3% of adults aged 18–64 years had a telemedicine visit with a health care professional in the past 12 months. The percentage was higher among women than men overall (41.7% versus 28.8%). Women were also more likely than were men to have had a telemedicine visit among those with private health insurance Read More >
Posted on byQuickStats: Percentage of Adults Aged ≥18 Years with Serious Psychological Distress in the Past 30 Days, by Sex and Age Group — National Health Interview Survey, United States, 2021
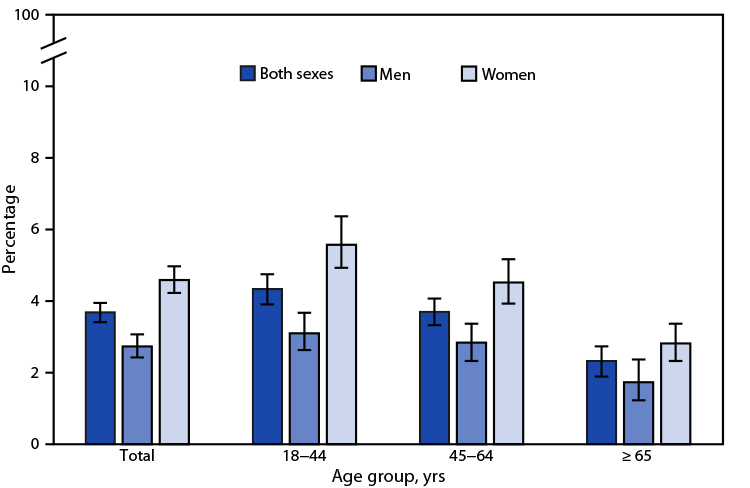
In 2021, 3.7% of adults aged ≥18 years had serious psychological distress in the past 30 days with percentages higher among women (4.6%) than among men (2.7%). The higher percentages among women were seen across all age groups: 5.6% versus 3.1% in adults aged 18–44 years, 4.5% versus 2.8% in those aged 45–64 years, and Read More >
Posted on byQuickStats: Percentage of Women Aged 50–74 Years Who Had a Mammogram Within the Preceding 2 Years by Family Income — National Health Interview Survey, United States, 2021
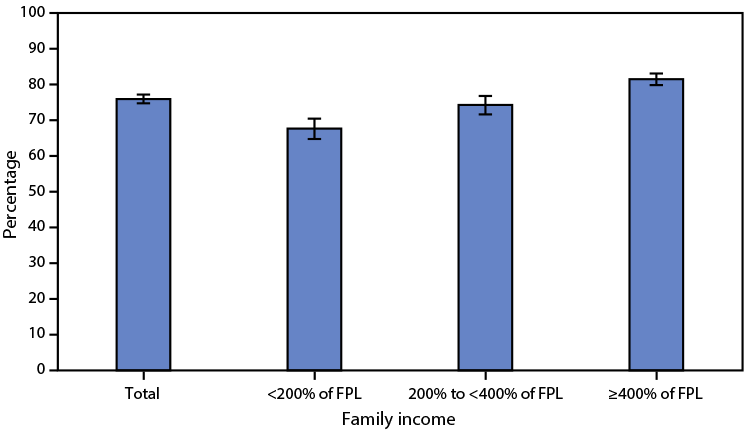
In 2021, 76.0% of women aged 50–74 years reported that they had a mammogram within the preceding 2 years. The percentage of women who had a mammogram within the preceding 2 years increased with family income, from 67.7% of women with family income <200% of federal poverty level (FPL), to 74.3% of women with income Read More >
Posted on byQuickStats: Percentage of Adults Aged ≥45 Years Who Use a Hearing Aid, by Sex and Age Group — National Health Interview Survey, United States, 2021
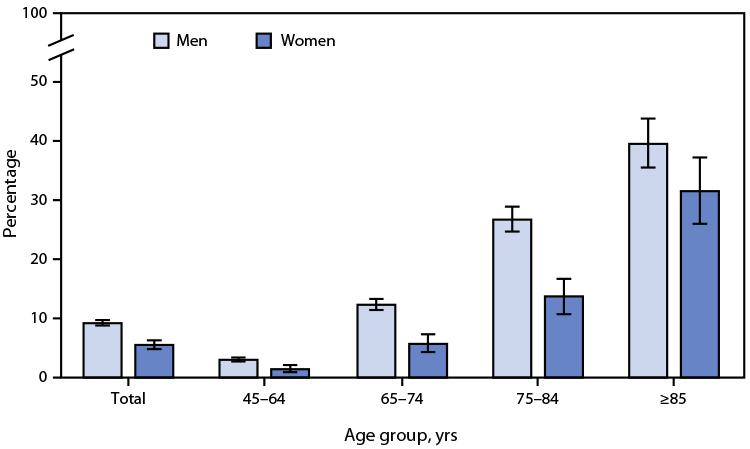
In 2021, among adults aged ≥45 years, men were more likely to use a hearing aid than were women (9.2% versus 5.5%). This pattern was found in all age groups: 3.0% of men versus 1.4% of women among those aged 45–64 years, 12.3% versus 5.7% among those aged 65–74 years, 26.7% versus 13.7% among those Read More >
Posted on byQuickStats: Percentage of Persons Who Used Telemedicine During the Past 12 Months, by Age Group — National Health Interview Survey, United States, 2021
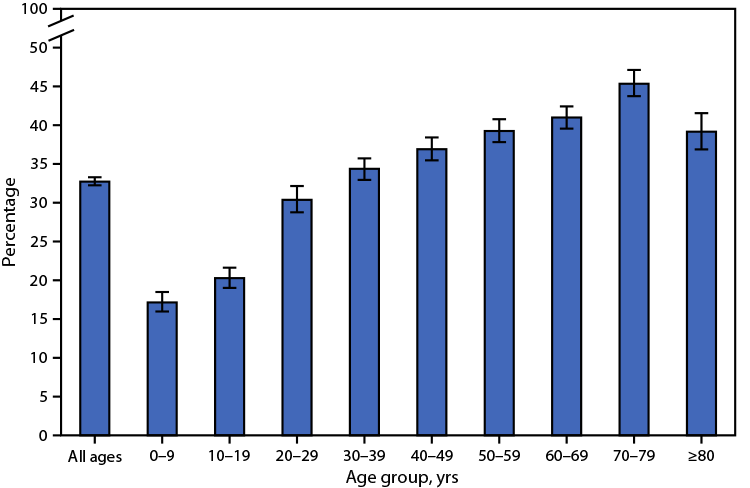
In 2021, approximately one third (32.8%) of persons of all ages had a telemedicine appointment with a doctor, nurse, or other health professional during the past 12 months. The percentage with a telemedicine appointment increased with age, from 17.2% among children aged <10 years to 45.5% among adults aged 70–79 years, and then decreased to Read More >
Posted on byQuickStats: Age-Adjusted Percentage of Adults Aged 18 Years or Older With Arthritis, by Sex and Race and Hispanic Origin — National Health Interview Survey, United States, 2021
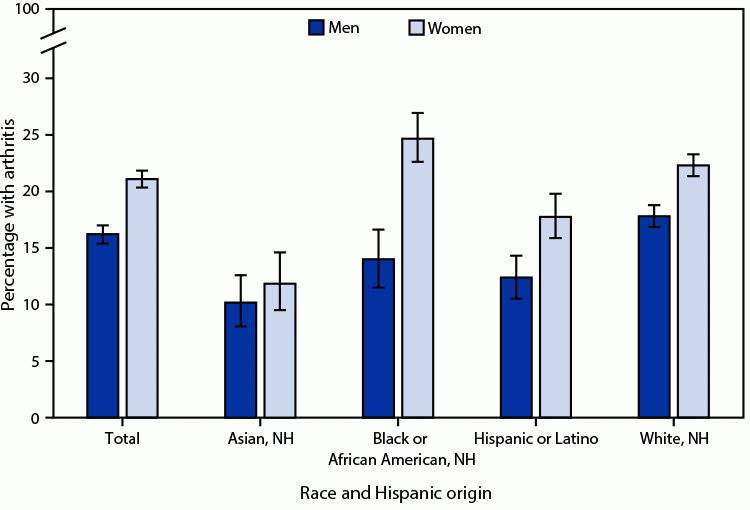
In 2021, among adults aged 18 years or older, women were more likely to have arthritis than men (21.0% versus 16.2%). This pattern was consistent among non-Hispanic White (White) (22.2% versus 17.7%), non-Hispanic Black or African American (Black) (24.6% versus 13.9%), and Hispanic or Latino (17.7% versus 12.4%) adults. Among non-Hispanic Asian (Asian) adults, the Read More >
Posted on byQuickStats: Birth Rates for Females Aged 15–19 Years, by Age Group — National Vital Statistics System, United States, 1991–2021
The birth rate for females aged 15–19 years declined from a 1991 peak of 61.8 per 1,000 females to a record low of 13.9 in 2021. From 1991 to 2021, the rate for females aged 15–17 years declined from 38.6 to 5.6 and from 94.0 to 26.6 for those aged 18–19 years. Most of the Read More >
Posted on byQuickStats: Percentage of Adults Aged 18 Years or Older Who Have Ever Had Hepatitis, by Age Group and Sex — National Health Interview Survey, United States, 2021
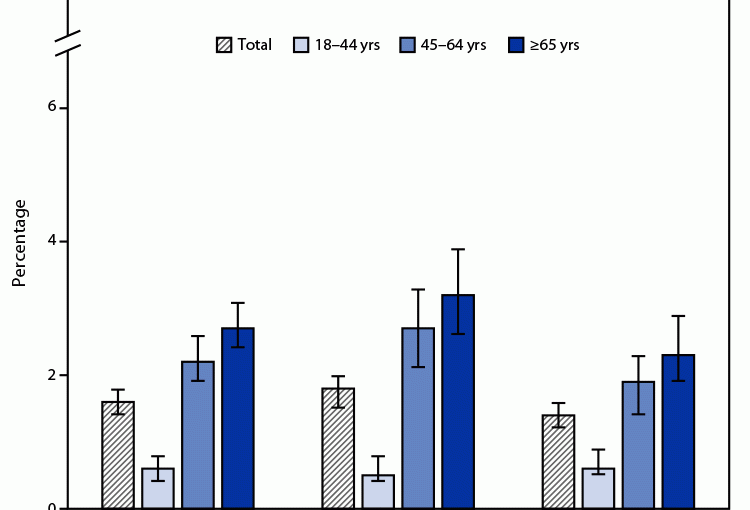
In 2021, 1.6% of adults aged 18 years or older reported having ever had hepatitis. The prevalence of hepatitis was lowest among adults aged 18–44 years (0.6%) and highest among adults aged ≥65 years (2.7%). Prevalence increased with age for both men and women. The percentage of adults who ever had hepatitis was higher in Read More >
Posted on byQuickStats: Percentage of Adults Aged ≥18 Years Living in Families That Were Food-Insecure in the Past 30 Days by Family Income and Urbanicity — National Health Interview Survey, United States, 2021
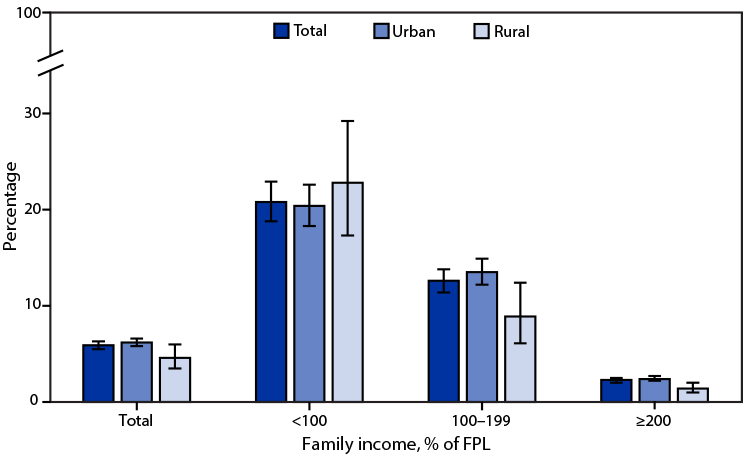
In 2021, 5.9% of adults aged ≥18 years lived in families that were food-insecure in the past 30 days. The percentage was higher in urban areas (6.2%) compared with rural areas (4.6%) overall and within households earning 100%–199% of FPL (13.5% versus 8.9%) and ≥200% of FPL (2.4% versus 1.4%). For adults living in families Read More >
Posted on byQuickStats: Age-Adjusted Rates of Alcohol-Induced Deaths by Urban-Rural Status — United States, 2000–2020
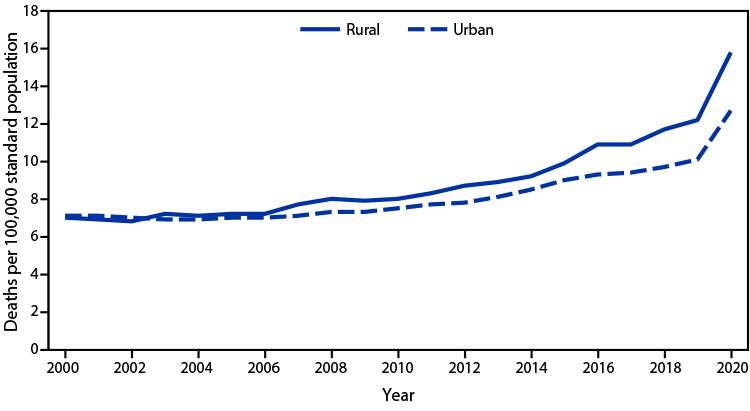
The age-adjusted rate of alcohol-induced deaths in 2020 was 13.1 per 100,000 standard population. From 2000 to 2020, the rate increased in both urban and rural counties: from 7.1 to 12.7 in urban counties and from 7.0 to 15.8 in rural counties. From 2019 to 2020, the rate increased by 26% for urban counties and 30% for rural counties, which Read More >
Posted on byQuickStats: Age-Adjusted Death Rates for Stroke Among Adults Aged ≥ 65 Years, by Region and Metropolitan Status — National Vital Statistics System, United States, 2020
In 2020, the age-adjusted death rate for stroke among adults aged ≥65 years was 260.5 deaths per 100,000 population with rates lower in metropolitan compared with nonmetropolitan areas (259.4 versus 265.5). The rate was highest among those living in the South (288.2) and lowest among those living in the Northeast (199.1). In the Northeast, the Read More >
Posted on byQuickStats: Emergency Department Visit Rates by Age Group — United States, 2019–2020
The emergency department (ED) visit rate for infants aged <1 year declined by nearly one half from 123 visits per 100 infants during 2019 to 68 during 2020. The ED visit rate for children and adolescents aged 1–17 years also decreased from 43 to 29 visits per 100 persons during the same period. Decreases among Read More >
Posted on byQuickStats: Age-Adjusted Death Rates from Stroke Among Adults Aged ≥65 Years, by Race and Hispanic Origin — National Vital Statistics System, United States, 2000–2020
Age-adjusted death rates from stroke among adults aged ≥65 years generally declined from 425.9 deaths per 100,000 standard population in 2000 to 250.0 in 2019 before increasing to 260.5 in 2020. During 2019–2020, stroke death rates increased for Hispanic adults (from 221.6 to 234.0), non-Hispanic Asian or Pacific Islander adults (from 203.9 to 216.4), non-Hispanic Read More >
Posted on byQuickStats: Percentage of Residential Care Communities that Offer Annual Influenza Vaccination to Residents and to Employees and Contract Staff Members, by Community Bed Size — United States, 2020
In 2020, 87.2% of residential care communities offered annual influenza vaccination to residents, and 77.8% offered annual influenza vaccination to all employees and contract staff members. The percentage of residential care communities offering annual influenza vaccination to residents and to all employees and contract staff members increased with increasing community bed size. The percentage of Read More >
Posted on by
