Category: QuickStats
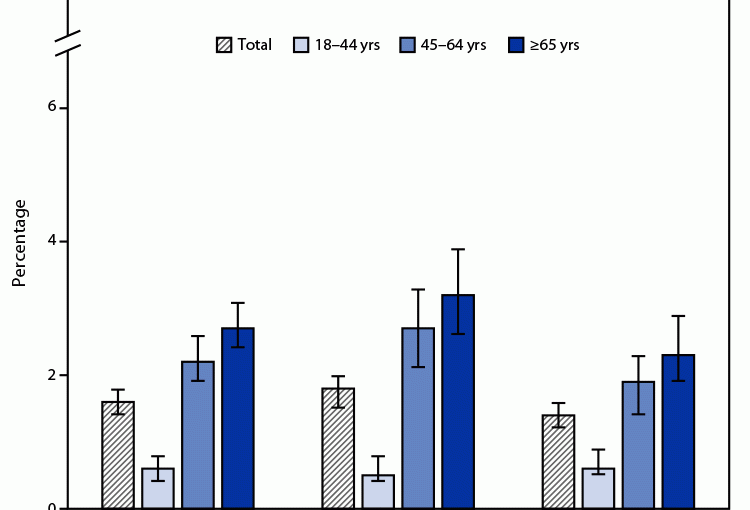
QuickStats: Percentage of Adults Aged 18 Years or Older Who Have Ever Had Hepatitis, by Age Group and Sex — National Health Interview Survey, United States, 2021

In 2021, 1.6% of adults aged 18 years or older reported having ever had hepatitis. The prevalence of hepatitis was lowest among adults aged 18–44 years (0.6%) and highest among adults aged ≥65 years (2.7%). Prevalence increased with age for both men and women. The percentage of adults who ever had hepatitis was higher in Read More >
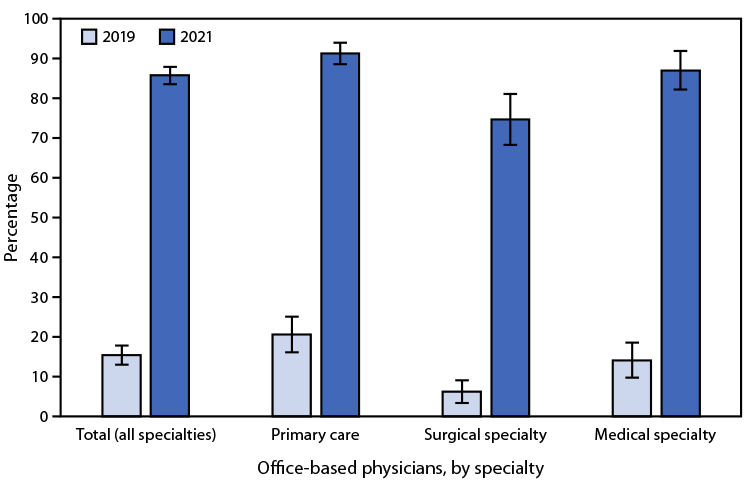
Posted on byQuickStats: Percentage of Office-Based Physicians Using Telemedicine Technology, by Specialty — United States, 2019 and 2021

From 2019 to 2021, the use of telemedicine technology increased for office-based physicians from 15.4% to 85.9%. In both 2019 and 2021, the use of telemedicine technology was higher among primary care physicians and medical specialty physicians than it was among surgical specialty physicians. In 2021, 91.4% of primary care physicians, 87.2% of medical specialty Read More >
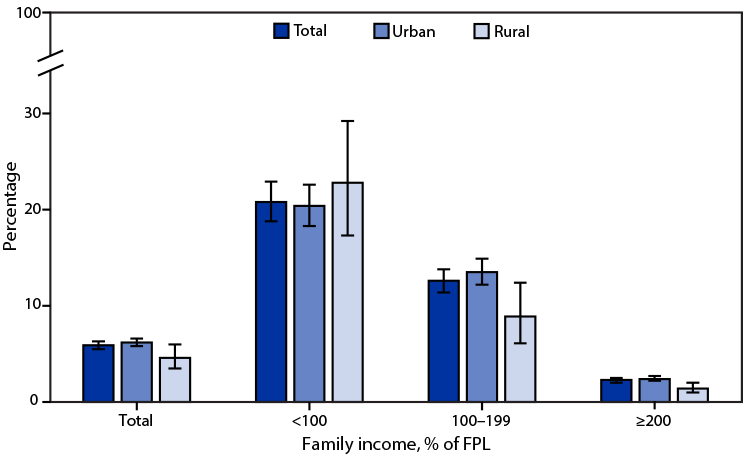
Posted on byQuickStats: Percentage of Adults Aged ≥18 Years Living in Families That Were Food-Insecure in the Past 30 Days by Family Income and Urbanicity — National Health Interview Survey, United States, 2021

In 2021, 5.9% of adults aged ≥18 years lived in families that were food-insecure in the past 30 days. The percentage was higher in urban areas (6.2%) compared with rural areas (4.6%) overall and within households earning 100%–199% of FPL (13.5% versus 8.9%) and ≥200% of FPL (2.4% versus 1.4%). For adults living in families Read More >
Posted on byQuickStats: Age-Adjusted Death Rates for Stroke Among Adults Aged ≥ 65 Years, by Region and Metropolitan Status — National Vital Statistics System, United States, 2020
In 2020, the age-adjusted death rate for stroke among adults aged ≥65 years was 260.5 deaths per 100,000 population with rates lower in metropolitan compared with nonmetropolitan areas (259.4 versus 265.5). The rate was highest among those living in the South (288.2) and lowest among those living in the Northeast (199.1). In the Northeast, the Read More >
Posted on byQuickStats: Age-Adjusted Death Rates from Stroke Among Adults Aged ≥65 Years, by Race and Hispanic Origin — National Vital Statistics System, United States, 2000–2020
Age-adjusted death rates from stroke among adults aged ≥65 years generally declined from 425.9 deaths per 100,000 standard population in 2000 to 250.0 in 2019 before increasing to 260.5 in 2020. During 2019–2020, stroke death rates increased for Hispanic adults (from 221.6 to 234.0), non-Hispanic Asian or Pacific Islander adults (from 203.9 to 216.4), non-Hispanic Read More >
Posted on byQuickStats: Percentage of Residential Care Communities that Offer Annual Influenza Vaccination to Residents and to Employees and Contract Staff Members, by Community Bed Size — United States, 2020
In 2020, 87.2% of residential care communities offered annual influenza vaccination to residents, and 77.8% offered annual influenza vaccination to all employees and contract staff members. The percentage of residential care communities offering annual influenza vaccination to residents and to all employees and contract staff members increased with increasing community bed size. The percentage of Read More >
Posted on byQuickStats: Percentage of Residential Care Communities that Use Electronic Health Records, by Community Bed Size — United States, 2016 and 2020
From 2016 to 2020, the percentage of residential care communities using electronic health records increased from 26% to 41%. The percentage using electronic health records increased from 28% to 41% for 11–25 bed communities, 35% to 54% for 26–50 bed communities, 43% to 71% for 51–100 bed communities, and 50% to 74% for more than Read More >
Posted on byQuickStats: Death Rates from Unintentional Falls Among Persons Aged ≥65 Years, by Age Group — National Vital Statistics System, United States, 1999–2020
During 1999–2020, death rates from unintentional falls among persons aged ≥65 years increased among all age groups. The largest increase occurred among persons aged ≥85 years, from 110.2 per 100,000 population in 1999 to 291.5 in 2020. Among persons aged 75–84 years, the rate increased from 31.5 to 67.9, and among those aged 65–74 years, Read More >
Posted on byQuickStats: Percentage of Total Deaths, by Age and Hispanic Origin and Race — United States, 2020
Significant differences in the age distribution of deaths by race and ethnicity were observed in the United States during 2020. Decedents aged <65 years accounted for 26% of all U.S. deaths, but they accounted for approximately 50% of deaths among American Indian or Alaska Native (AI/AN) and Native Hawaiian or other Pacific Islander (NH/OPI) persons, Read More >
Posted on byQuickStats: Age-Adjusted Suicide Rates, by Urbanization Level and Sex — National Vital Statistics System, 2020
In 2020, age-adjusted suicide rates among females increased as the level of urbanization declined, from 4.6 per 100,000 population in large central metropolitan areas to 7.1 in small metropolitan areas, but were similar for small metropolitan, micropolitan, and noncore areas. Rates among males were lowest in large central areas (16.9) and increased as the level Read More >
Posted on byQuickStats: Percentage of Children and Adolescents Aged 6–17 Years Who Have Roads, Sidewalks, Paths, or Trails Where They Can Walk or Ride a Bicycle, by Urban-Rural Status and Family Income
During 2020, 88.7% of children and adolescents aged 6–17 years had roads, sidewalks, paths, or trails in their neighborhood or near their home where they could walk or ride a bicycle. Availability of these spaces was less common among children and adolescents who lived in families with incomes <200% of FPL (85.6%) than among those Read More >
Posted on byQuickStats: Deaths Involving Exposure to Excessive Heat, by Sex — National Vital Statistics System, United States, 1999–2020
During 1999–2020, the annual number of deaths from excessive natural heat ranged from a low of 297 in 2004 to a high of 1,153 in 2020. The number of deaths among males increased from 622 deaths in 1999 to 822 deaths in 2020, but there was no statistically significant increase among females. During 1999–2020, there Read More >
Posted on byQuickStats: Percentage of Adults Aged ≥65 Years Who Drank Four or More Alcoholic Drinks Per Week, by Sex and Age — National Health Interview Survey, United States, 2020
In 2020, 18.3% of adults aged ≥65 years reported drinking four or more alcoholic drinks per week. Among adults aged ≥65 years, men were more likely (25.6%) than women (12.4%) to have four or more drinks. Percentages of those having four or more drinks were higher among men than women for the following age groups: Read More >
Posted on byQuickStats: Age-Adjusted Drug Overdose Death Rates Among Workers Aged 16–64 Years in Usual Occupation Groups with the Highest Drug Overdose Death Rates — National Vital Statistics System, United States, 2020
In 2020, the age-adjusted drug overdose death rate among workers with paid, civilian usual occupations was 42.1 deaths per 100,000. Drug overdose death rates were highest among workers in the following occupations: construction and extraction (162.6); food preparation and serving related (117.9); personal care and service (74.0); transportation and material moving (70.7); building and grounds Read More >
Posted on byQuickStats: Percentage of Uninsured Adults Aged 18−64 Years, by Race, Hispanic Origin, and Selected Asian Subgroups — National Health Interview Survey, United States, 2019−2020
During 2019–2020, the percentage of U.S. adults aged 18–64 years who were uninsured was 14.4%. Among all race and Hispanic origin groups, non-Hispanic Asian adults (7.8%) were the least likely to be uninsured followed by non-Hispanic White (9.7%), non-Hispanic Black (14.6%), and Hispanic adults (30.4%). Among the non-Hispanic Asian subgroups shown, adults of Korean (14.3%) Read More >
Posted on byQuickStats: Age-Adjusted Percentage of Adults Aged ≥18 Years Who Met the 2018 Federal Physical Activity Guidelines for Both Muscle-Strengthening and Aerobic Physical Activity, by Urbanization Level — National Health Interview Survey, United States, 2020
In 2020, 25.3% of adults aged ≥18 years met the 2018 federal physical activity guidelines for both muscle-strengthening and aerobic physical activity. The percentage meeting both guidelines was highest in adults living in large central metropolitan (28.0%) and large fringe metropolitan areas (27.6%), followed by those living in medium and small metropolitan areas (23.4%) and Read More >
Posted on byQuickStats: Age-Adjusted Death Rates for Motor Vehicle Traffic Injury, by Race and Hispanic Origin — United States, 2019 and 2020
Age-adjusted death rates for motor vehicle traffic injury increased from 11.1 per 100,000 population in 2019 to 12.0 in 2020. The rates increased from 10.3 to 11.3 for Hispanic persons, from 14.5 to 18.3 for non-Hispanic Black persons, and from 11.2 to 11.6 for non-Hispanic White persons. The changes in rates among other groups were Read More >
Posted on byQuickStats: Percentage of Uninsured Adults Aged 18–64 Years, by Race and Selected Hispanic Origin Subgroup — National Health Interview Survey, United States, 2019−2020
During 2019–2020, the percentage of U.S. adults aged 18–64 years who were uninsured was 14.4%. Among all race and Hispanic origin subgroups, those most likely to be uninsured were Hispanic adults (30.4%) followed by non-Hispanic Black (14.6%), non-Hispanic White (9.7%), and non-Hispanic Asian (7.8%) adults. Among the Hispanic origin subgroups included, those most likely to Read More >
Posted on byQuickStats: Percentage Distribution of Heat-Related Deaths by Age Group — National Vital Statistics System, United States, 2018–2020
During 2018–2020, a total of 3,066 heat-related deaths occurred. The highest percentage of heat-related deaths occurred among persons aged 55–64 years (19%), and the lowest percentage occurred among those aged 5–14 years (1%). Among those aged 5–14 through aged 55–64 years, the percentage of heat-related deaths increased with age, then decreased through those aged ≥85 Read More >
Posted on byQuickStats: Percentage of Adults Aged ≥18 Years with Diagnosed Heart Disease, by Urbanization Level and Age Group — National Health Interview Survey, United States, 2020
In 2020, 6.3% percent of adults aged ≥18 years had diagnosed heart disease. The prevalence of heart disease among adults aged ≥18 years was higher among those living in nonmetropolitan areas (8.8%) compared with those living in metropolitan areas (5.8%). Prevalence increased with age from 0.9% among adults aged 18–44 years to 5.9% among those Read More >
Posted on byQuickStats: Percentage Distribution of Deaths Involving Injuries from Recreational and Nonrecreational Use of Watercraft, by Month — United States, 2018–2020
During 2018–2020, 1,508 deaths occurred involving injuries from recreational and nonrecreational use of watercraft. The percentage of deaths each month ranged from 3.0% in December to 16.6% in July. Most deaths (68.6%) occurred during May–September. Source: National Vital Statistics System, Mortality Data. https://www.cdc.gov/nchs/nvss/deaths.htm https://www.cdc.gov/mmwr/volumes/71/wr/mm7121a5.htm Read More >
Posted on byQuickStats: Percentage of Adults Aged ≥18 Years Who Felt That Crime Makes It Unsafe to Walk, by Sex and Age Group — National Health Interview Survey, United States, 2020
In 2020, 11.0% of adults aged ≥18 years felt that crime made it unsafe for them to walk. Percentages were lower for men (8.9%) than for women (13.0%). Men were less likely than women to feel unsafe walking because of crime in all age groups (18–24 years: 9.3% of men compared with 17.1% of women; Read More >
Posted on byQuickStats: Percentage of Suicides and Homicides Involving a Firearm Among Persons Aged ≥10 Years, by Age Group — National Vital Statistics System, United States, 2020
In 2020, among persons aged ≥10 years, the percentage of suicide deaths that involved a firearm was lowest among those aged 25–44 years (45.1%) and highest among those aged ≥65 years (70.8%). The percentage of homicide deaths that involved a firearm decreased with age, from 91.6% among those aged 10–24 years to 46.0% among those Read More >
Posted on byQuickStats: Percentage of Adults Aged ≥18 Years Who Met the Federal Guidelines for Muscle-Strengthening Physical Activity, by Age Group and Sex — National Health Interview Survey, United States, 2020
In 2020, 35.2% of men and 26.9% of women aged ≥18 years met the federal guideline for muscle-strengthening physical activity. The percentage of men who met the muscle-strengthening guideline decreased with age from 44.5% for those aged 18–44 years, to 29.9% for those aged 45–64 years, and to 22.0% for those aged ≥65 years. The Read More >
Posted on byQuickStats: Percentage of Currently Employed Adults Aged ≥18 Years Who Had Paid Sick Leave Benefits at Last Week’s Job or Business, by Region — National Health Interview Survey, United States, 2019 and 2020
The percentage of currently employed adults who had access to paid sick leave increased from 62.1% in 2019 to 66.5% in 2020. During this period, increases were noted among all regions of the country (Northeast: from 65.6% to 69.8%, Midwest: from 60.1% to 64.5%, South: from 59.1% to 63.5%, and West: from 65.8% to 70.3%). Read More >
Posted on by
