Category: Cancer
New Reports Confirm U.S. Life Expectancy Increased while Drug Overdose Deaths Decreased in 2023

U.S. life expectancy increased in 2023, reaching its highest level since the COVID-19 pandemic, according to final mortality data released today. The data are featured in two new reports from CDC’s National Center for Health Statistics (NCHS). “Mortality in the United States: 2023” is the first public release of final mortality data for 2023. The Read More >
Posted on byThe National Center for Health Statistics Launches New Rapid Surveys System

Rapid and reliable response to public health needs has never been more crucial than in today’s world. The National Center for Health Statistics is now partnering with other CDC programs and government survey experts to fill information gaps by providing access to timely data through its new Rapid Surveys System. WHAT ARE RAPID SURVEYS? Rapid Read More >
Posted on byColon Cancer Deaths in the United States: 1999-2021

Year Deaths Age Adjusted Rate* 1999 48,433 17.7 2000 48,570 17.6 2001 47,860 17 2002 47,586 16.6 2003 46,868 16.1 2004 44,591 15.1 2005 43,989 14.6 2006 44,061 14.3 2007 43,969 14 2008 43,396 13.6 2009 42,199 12.9 2010 42,009 12.6 2011 41,822 12.2 2012 41,488 11.9 2013 41,502 11.6 2014 41,526 11.4 2015 42,126 Read More >
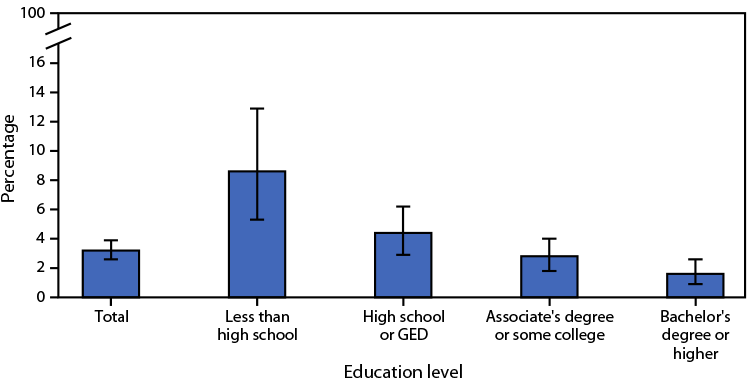
Posted on byQuickStats: Percentage of Adults Aged ≥45 Years Who Have Ever Had Lung Cancer by Education Level — National Health Interview Survey, United States, 2021

In 2021, 3.2% of adults aged ≥45 years had ever been told they had lung cancer. The prevalence of lung cancer among adults aged ≥45 years was highest for those with less than a high school education (8.6%). The percentage of adults who had ever had lung cancer decreased with increasing education level, with the Read More >
Posted on byTesticular Cancer Deaths in U.S. from 1999-2020
Year Deaths 1999 378 2000 338 2001 335 2002 393 2003 344 2004 357 2005 359 2006 358 2007 326 2008 358 2009 376 2010 399 2011 380 2012 386 2013 383 2014 411 2015 374 2016 431 2017 425 2018 401 2019 458 2020 461 TOTAL 8,431 Source: CDC WONDER ICD-10 Codes: C62.0, C62.1, Read More >
Posted on byQuickStats: Age-Adjusted Death Rates for Female Breast Cancer, by State — National Vital Statistics System, United States, 2019
In 2019, the age-adjusted rate of female breast cancer deaths in the United States was 19.4 per 100,000 population. Jurisdictions in the highest category for breast cancer death rates were DC (24.5), Nevada (23.7), Nebraska (22.4), Kentucky (22.2), Louisiana (22.0), and Mississippi (22.0). Those in the lowest category were North Dakota (14.8), Massachusetts (15.3), Vermont Read More >
Posted on byQ & A: Trends in Death Rates in Urban and Rural Areas: United States, 1999–2019
Questions for Sally Curtin, Health Statistician and Lead Author of “Trends in Death Rates in Urban and Rural Areas: United States, 1999–2019.” Q: Why did you decide to do a report comparing death rates in rural and urban areas? SC: In many of our reports, we have examined trends in various causes of death by Read More >
Posted on byQuickStats: Age-Adjusted Death Rates for Cancer, by Urban-Rural Status and Sex — National Vital Statistics System, United States, 1999–2019
Cancer death rates declined among males and females during 1999–2019 in urban areas from 249.6 per 100,000 to 168.4 for males and from 168.2 to 123.9 for females. Rates also declined in rural areas from 262.4 to 195.6 for males and from 165.4 to 139.2 for females. Throughout the period, cancer death rates were higher Read More >
Posted on byQuickStats: Death Rates from Colorectal Cancer by Age Group — United States, 1999–2019
During 1999–2019, deaths per 100,000 persons from colorectal cancer decreased among persons aged 55–64 years (from 33.5 to 24.4), persons aged 65–74 years (from 77.4 to 41.5), and persons aged 75–84 years (from 146.7 to 77.9). The death rate from colorectal cancer among persons aged 45–54 years generally increased from 1999 (11.1) to 2019 (12.0). Read More >
Posted on byPatterns of Mammography, Pap Smear, and Colorectal Cancer Screening Services Among Women Aged 45 and Over
Questions for Yelena Gorina, Health Statistician and Lead Author of “Patterns of Mammography, Pap Smear, and Colorectal Cancer Screening Services Among Women Aged 45 and Over.” Q: Why did you decide to focus on screening for breast, cervical, and colorectal cancers in women? YG: I was thinking about this topic since many years ago my Read More >
Posted on byNCHS UPDATES”STATS OF THE STATES” PAGE WITH LATEST FINAL DATA
The CDC National Center for Health Statistics web page “Stats of the States” has been updated to include the latest state-based final data on selected vital statistics topics, including: General fertility rates Teen birth rates Selected other maternal and infant health measures Marriage & divorce rates Leading causes of death Other high profile causes of Read More >
Posted on byQuickStats: Age-Adjusted Lung Cancer Death Rates by State — National Vital Statistics System, United States, 2018
In 2018, the age-adjusted lung cancer death rate in the United States was 34.8 per 100,000. Twenty-one states had a higher lung cancer death rate than the national rate, 15 states and DC had lower death rates, and 14 states had rates that were not statistically different from the national rate. Most states with higher Read More >
Posted on byQuickStats: Percentage of Adults Aged 50–75 Years Who Received Colorectal Cancer Screening by Poverty Status and Year — National Health Interview Survey, United States, 2010 and 2018
The percentage of adults aged 50–75 years who received colorectal cancer tests or procedures increased from 58.7% in 2010 to 65.5% in 2018. The percentage increased from 2010 to 2018 in all income groups: from 37.9% to 53.1% among poor, 47.9% to 56.7% among near poor, and 63.6% to 68.7% among not poor adults. In Read More >
Posted on byQuickstats: Cancer and Heart Disease Death Rates Among Men and Women Aged 45–64 Years — United States, 1999–2018
The cancer death rate for both men and women aged 45–64 years declined steadily from 247.0 per 100,000 in 1999 to 194.9 in 2018 for men and from 204.1 to 166.3 for women. The heart disease death rate for men declined from 1999 (235.7) to 2011 (183.5) but then increased to 192.9 in 2018. For Read More >
Posted on byQuickStats: Percentage of Adults Aged 50–75 Years Who Met Colorectal Cancer (CRC) Screening Recommendations — National Health Interview Survey, United States, 2018
March is Colorectal Awareness Month. 67% of U.S. adults aged 50–75 years met the U.S. Preventive Services Task Force recommendations for colorectal cancer screening. Most persons (60.6%) had a colonoscopy in the past 10 years. Cancer screening leads to early detection, and early detection saves lives. Source: National Health Interview Survey, 2018. https://www.cdc.gov/nchs/nhis.htm. https://www.cdc.gov/mmwr/volumes/69/wr/mm6911a7.htm Read More >
Posted on byBreast Cancer Screening Among Women by Nativity, Birthplace, and Length of Time in the United States
Questions for Lead Author Tainya Clarke, Health Statistician, of “Breast Cancer Screening Among Women by Nativity, Birthplace, and Length of Time in the United States.” Q: Why did you decide to do a report on mammography screening among women by nativity? TC: There is currently limited published research on how nativity, birthplace and/or lifetime in Read More >
Posted on byQuickStats: Age-Adjusted Death Rates from Female Breast Cancer by State — National Vital Statistics System, United States, 2017
In 2017, the overall age-adjusted death rate for female breast cancer was 19.9 per 100,000 population. The highest death rates were in Mississippi (25.5), DC (24.3), and Louisiana (23.6). The lowest death rates were in Hawaii (15.6), Alaska (16.3), New Hampshire (16.3), Wyoming (16.5), Rhode Island (16.6), Minnesota (16.7), South Dakota (17.3), Wisconsin (17.4), and Read More >
Posted on by2017 Final Deaths, Leading Causes of Death and Life Tables Reports Released
NCHS released a report that presents the final 2017 data on U.S. deaths, death rates, life expectancy, infant mortality, and trends, by selected characteristics such as age, sex, Hispanic origin and race, state of residence, and cause of death. Key Findings: In 2017, a total of 2,813,503 deaths were reported in the United States. The Read More >
Posted on byQuickStats: Age-Adjusted Death Rates from Prostate Cancer, by Race/ Ethnicity — National Vital Statistics System, United States, 1999–2017
In 2017, the age-adjusted prostate cancer death rate among all males was 18.7 per 100,000, down from 31.3 in 1999. During 1999–2017, non-Hispanic black males had the highest prostate cancer death rate. In 2017, the rate for non-Hispanic black males was 36.8, compared with 17.8 for non-Hispanic white males and 15.4 for Hispanic males. Source: Read More >
Posted on byTrends in Cancer and Heart Disease Death Rates Among Adults Aged 45–64: United States, 1999–2017
Questions for Sally Curtin, M.A., Statistician, and Lead Author of “Trends in Cancer and Heart Disease Death Rates Among Adults Aged 45–64: United States, 1999–2017.” Q: Why are death rates from cancer dropping steadily over time and why are death rates from heart disease starting to rise? SC: The death rates are a reflection of Read More >
Posted on byQuickStats: Percentage of U.S. Women Aged 50–74 Years Who Have Ever Had Breast Cancer by Race and Hispanic Origin
During 2015–2017, 5.3% of U.S. women aged 50–74 years had ever been told they had breast cancer. Non-Hispanic white women were more likely to have ever been told they had breast cancer (6.1%) compared with Hispanic women (3.2%) and non-Hispanic black women (3.6%). There was no significant difference in the prevalence of breast cancer between Read More >
Posted on byTrends in Liver Cancer Mortality Among Adults Aged 25 and Over in the United States, 2000-2016
Questions for Lead Author Jiaquan Xu, M.D., Epidemiologist, and Author of “Trends in Liver Cancer Mortality Among Adults Aged 25 and Over in the United States, 2000-2016” Q: What made you decide to focus on liver cancer deaths for this study? JX: It was the dramatic rise in the death rate for liver cancer that Read More >
Posted on byQuickStats: Breast Cancer Death Rates Among Women Aged 50–74 Years, by Race/Ethnicity — National Vital Statistics System, United States, 2006 and 2016
The U.S. death rate from breast cancer among all women aged 50–74 years decreased 15.1%, from 53.8 per 100,000 in 2006 to 45.7 in 2016. In both 2006 and 2016, the death rate was higher among non-Hispanic black women compared with non-Hispanic white women and Hispanic women. From 2006 to 2016, the death rate from Read More >
Posted on byStat of the Day – March 7, 2018
#STATOFTHEDAY Nearly 2 in 3 adults age 50-75 (62.4%) received #Colorectal #Screening in 2015 compared to 1 in 3 adults age 50-75 (33.9%) in 2000 https://t.co/vvYVIGARsZ #NationalColorectalCancerAwarenessMonth — NCHS (@NCHStats) March 7, 2018 Read More >
Posted on byStat of the Day – July 18, 2017
#STATOFTHEDAY #Cancer is the leading cause of death among Asian/Pacific Islanders in the US (2014 data) https://t.co/iDhani5wTs — NCHS (@NCHStats) July 18, 2017 Read More >
Posted on by
