Category: adults
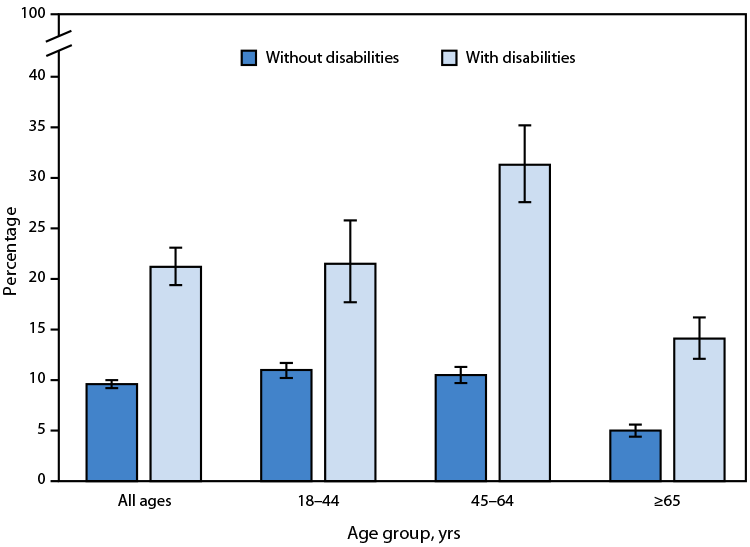
QuickStats: Percentage of Adults Aged ≥18 Years Who Were in Families Having Problems Paying Medical Bills in the Past 12 Months, by Disability Status and Age Group — United States, 2023

In 2023, the percentage of adults aged ≥18 years who were in families having problems paying medical bills in the past 12 months was higher among those with disabilities (21.2%) compared with those without disabilities (9.6%). This pattern was observed across all age groups. Supplementary Table: https://stacks.cdc.gov/view/cdc/164154 Source: National Center for Health Statistics, National Health Interview Read More >
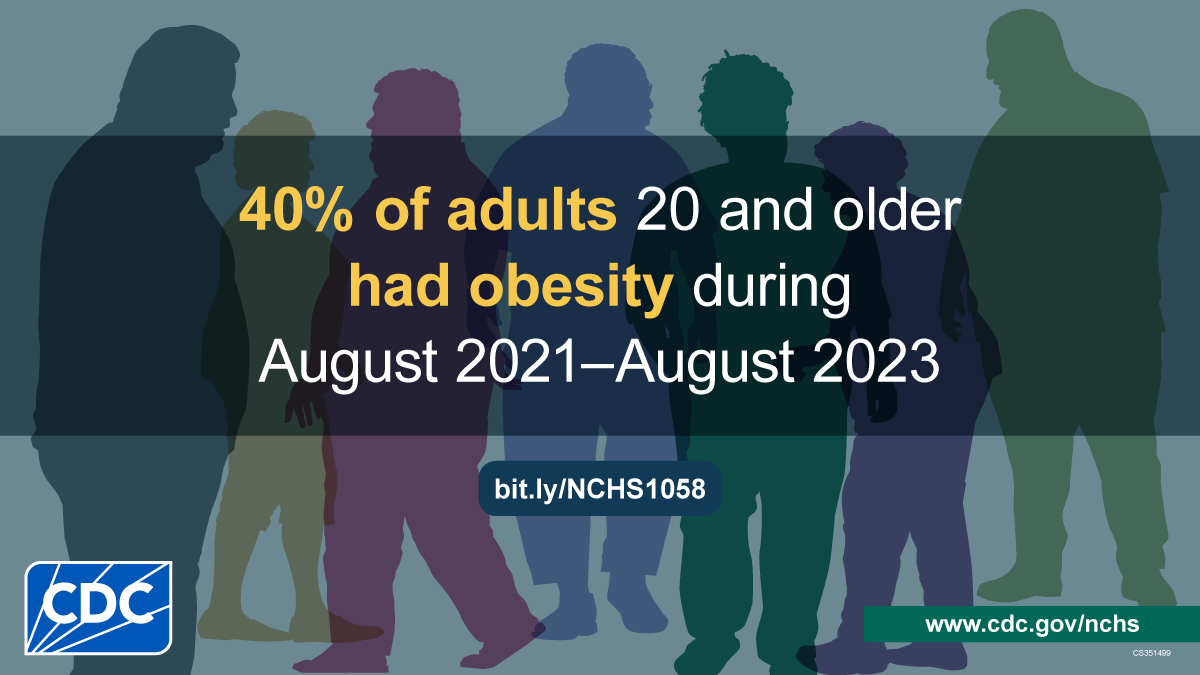
Posted on byNHANES August 2021–August 2023 Data Released with Obesity Report

CDC’s National Center for Health Statistics recently released its first wave of data files from the August 2021-August 2023 cycle of the National Health And Nutrition Examination Survey (NHANES). NCHS also published the first report analyzing these data. The report, Obesity and Severe Obesity Prevalence in Adults: United States, August 2021–August 2023, describes recent trends Read More >
Posted on by
