NCHS Data Query System Launches New Features
Posted on by
The National Center for Health Statistics (NCHS) released new features and enhancements to its Data Query System (DQS).
DQS, originally launched in spring of 2024, is an online query and visualization tool that compiles statistics from more than 150 health topics into one easily searchable resource. DQS helps you access thousands of health estimates from national data sources without requiring you to visit multiple websites or have prior knowledge of data access tools.
DQS provides you with multiple ways to visualize trends in health data and the ability to download data in table, chart, and map formats. New topics are also added to DQS regularly. Additionally, DQS allows you to easily customize your searches based on demographic, geographic, and socioeconomic groups, enabling you to explore statistics on health topics and populations that matter to you.
DQS Enhancements
So, what’s new? DQS added new features that are designed to enhance your experience by providing you with more query and visualization options. DQS is more “data driven” than ever, meaning you get data updates faster.
By incorporating more plain language and providing a more intuitive user interface, DQS is now easier for you to understand and use, whether you’re accessing it by desktop or mobile device.
Other improvements include:
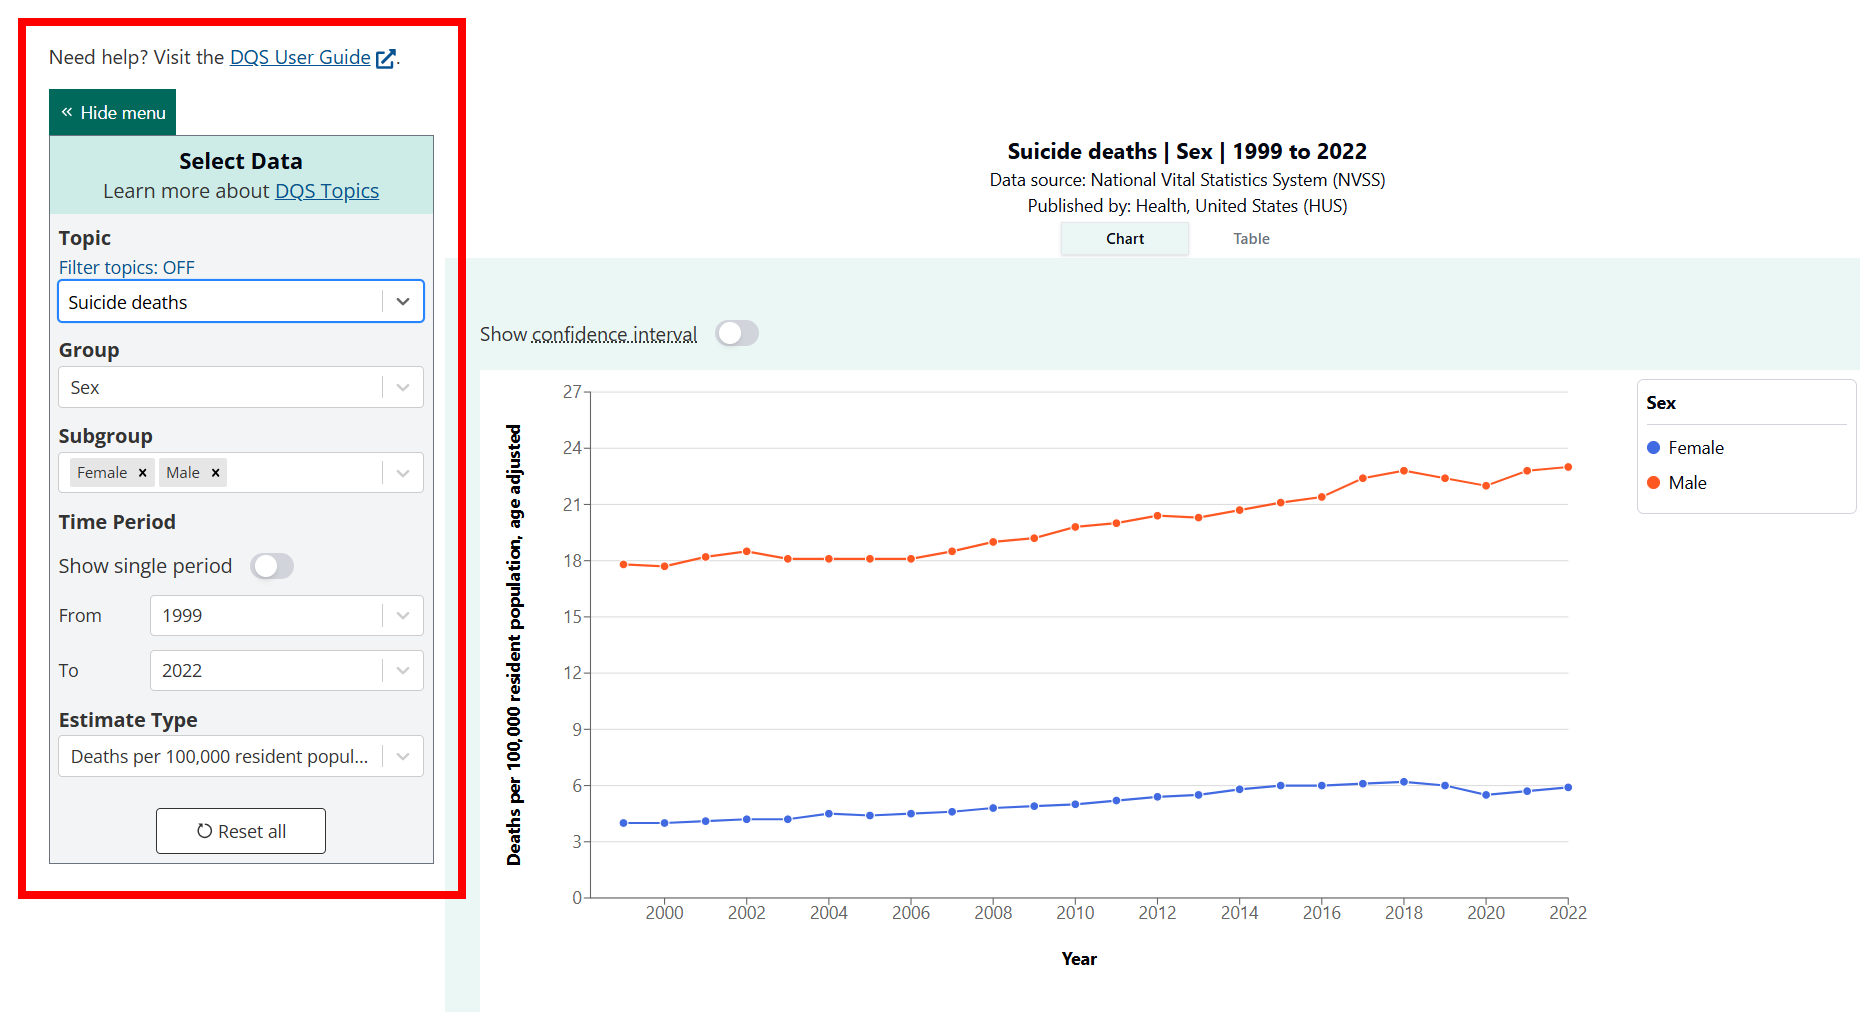
- New menu placement and more menu options. With a new vertical menu, DQS offers you even more search and display options in one place. You can now easily view your selections and the visualization at the same time.
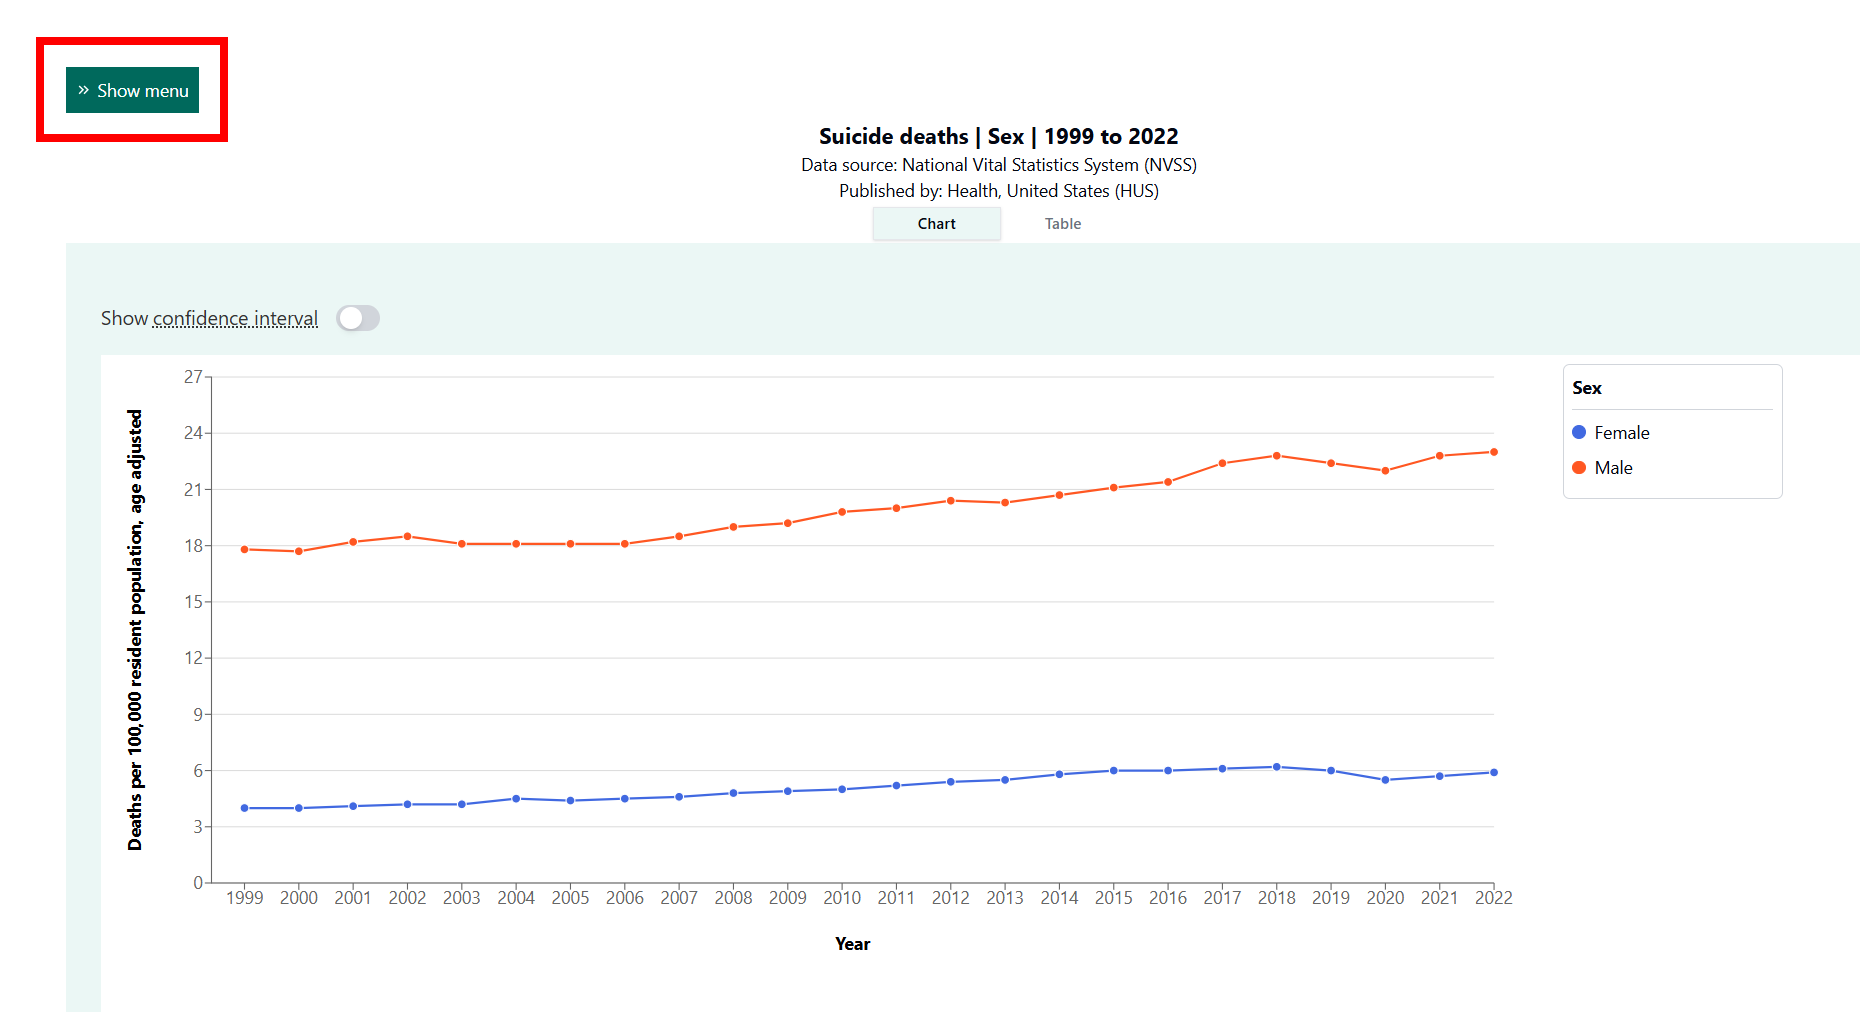
- Option to hide and show menu. To maximize the display, you can hide the menu and then show it again to change your selections.
- More ways to filter DQS topics. You can filter DQS topics by characteristics, sources, and now by major health areas: health status and determinants, healthcare access and utilization, healthcare expenditures and payers, and healthcare resources.
- New direct linking. Connect someone directly to a customized visualization of your choice within DQS by providing them the URL or putting it in a message, webpage, or social media post.
- Citations on downloadable images. Citations are automatically included on charts and maps, eliminating the need for you to copy this information from the webpage.
- Increased subgroup maximum. You can select up to nine subgroups at a time for your visualizations.
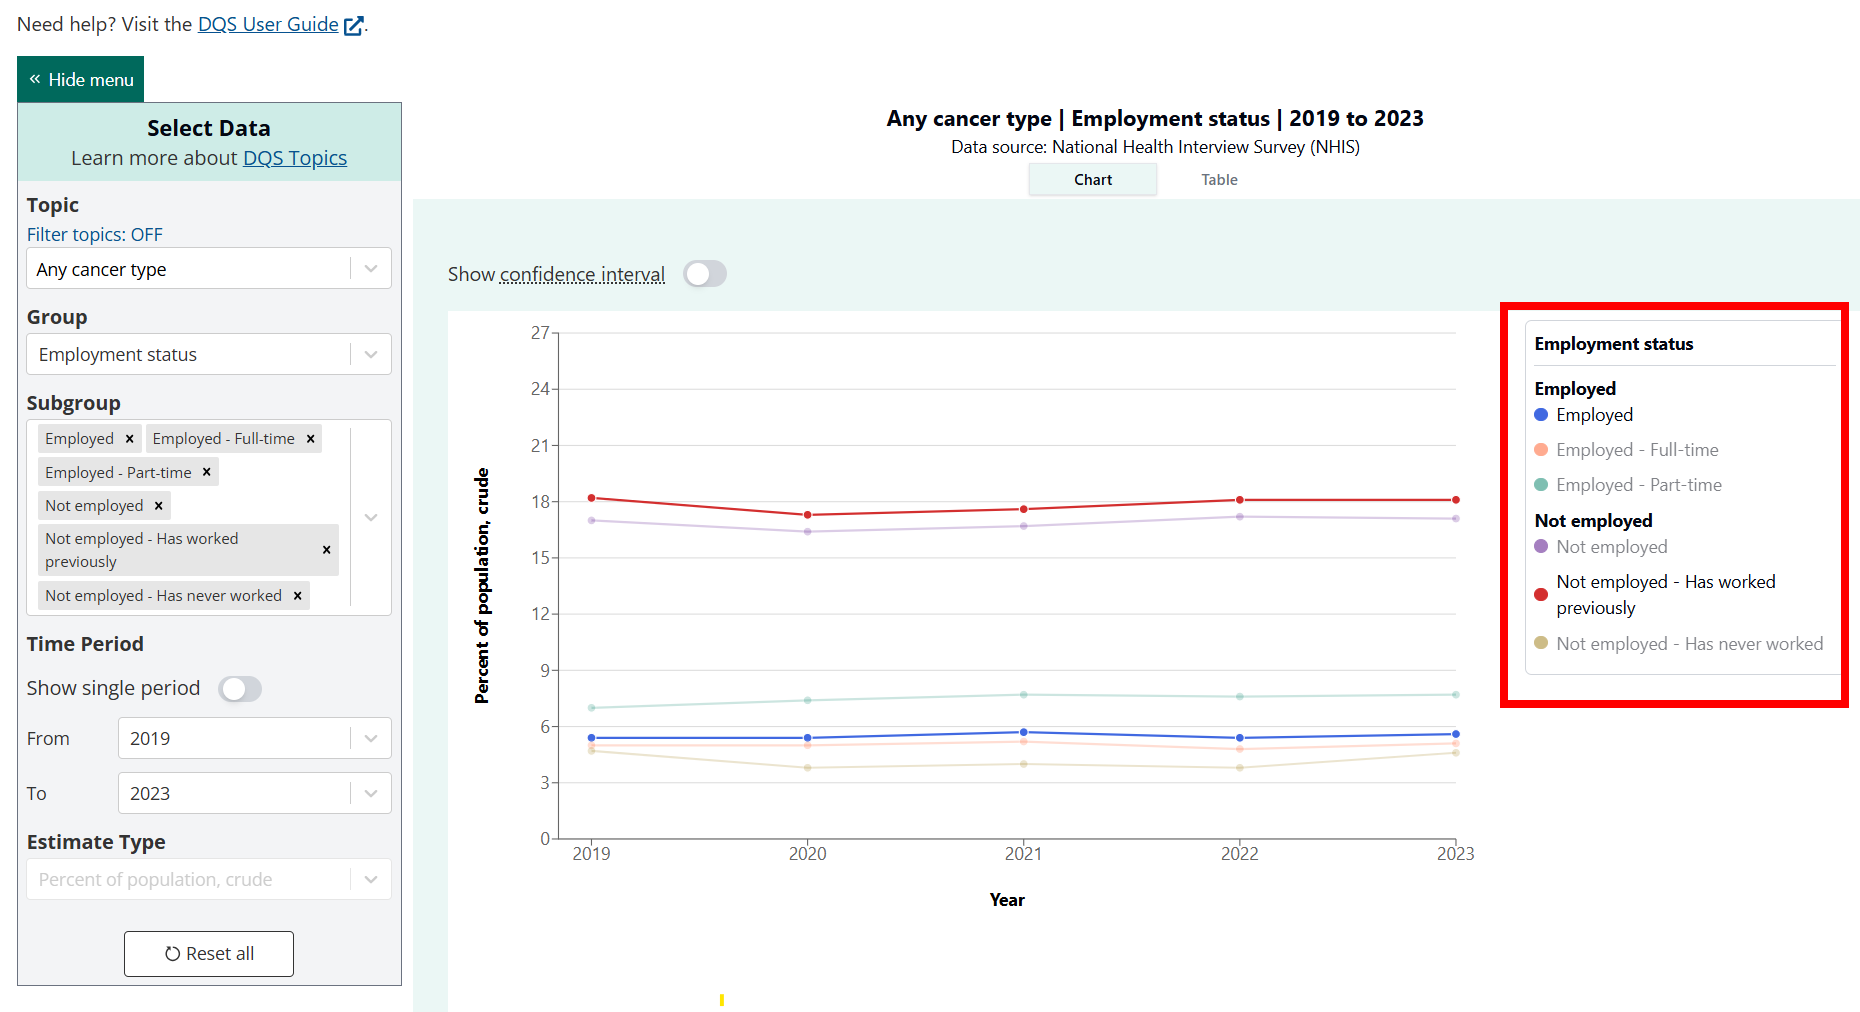
- Subgroups with bold headers. Information in the selectors and legend are labeled in a way that makes relationships between subgroups clear.
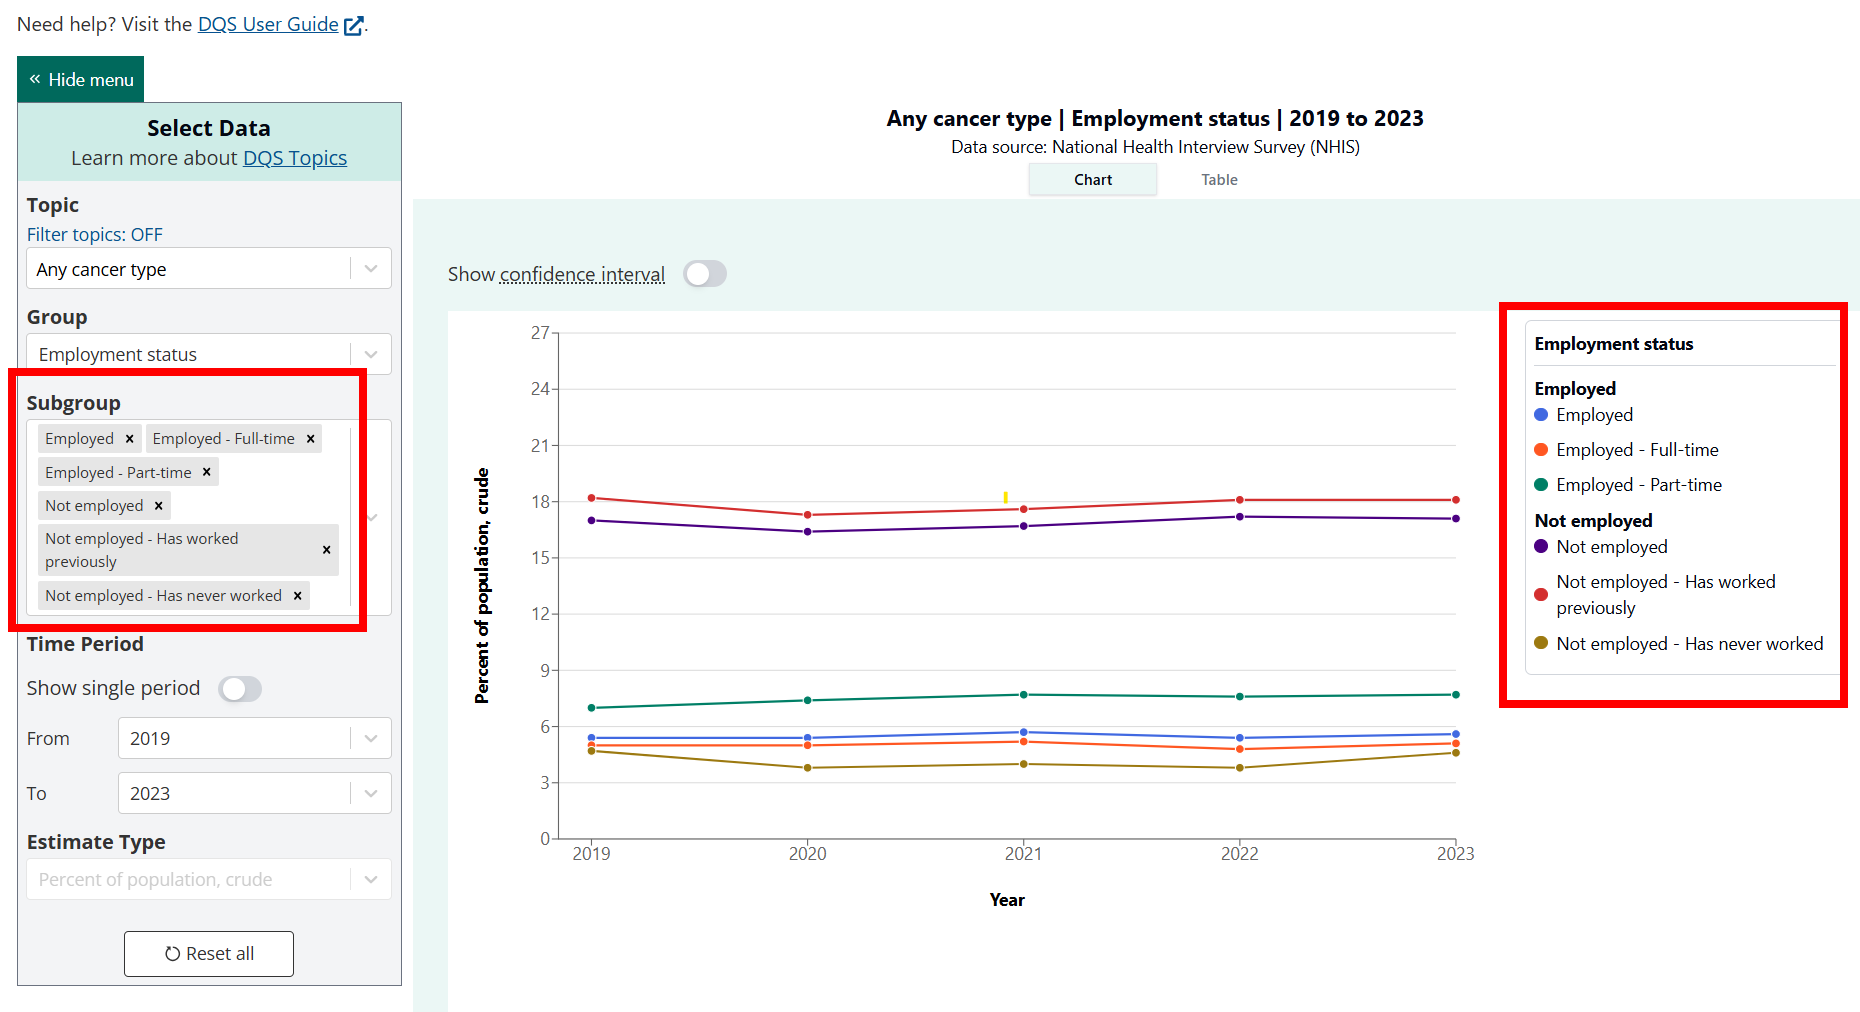
- Selectable legends. You can select specific subgroups from the legend to highlight in the chart, making it easier to focus and customize your downloadable visualizations.
Check out these new features by visiting the NCHS Data Query System webpage. For more information on how to use DQS, please refer to the DQS User Guide. You can also explore the full list of topics available in DQS on the Health Topics page. Finally, don’t forget to subscribe to the DQS listserv to receive news on future DQS updates.
Posted on by