U.S. Mortality Trends Over the Past 113 Years
Posted on by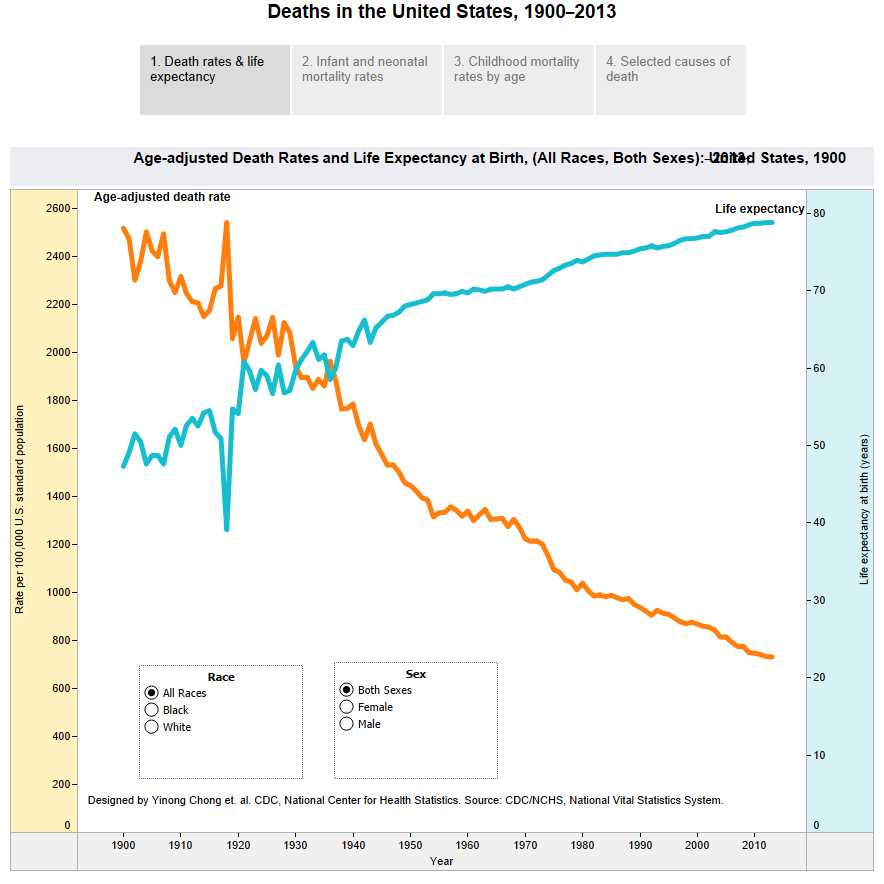 This storyboard of U.S. mortality trends over the past 113 years highlights the differences in age-adjusted death rates and life expectancy at birth by race and sex; neonatal mortality and infant mortality rates by race; childhood mortality rates by age; and trends in age-adjusted death rates for five selected major causes of death.
Posted on by
Categories Deaths
Page last reviewed: August 4, 2015
Page last updated: August 4, 2015
Content source:
CDC, National Center for Health Statistics