Category: disability
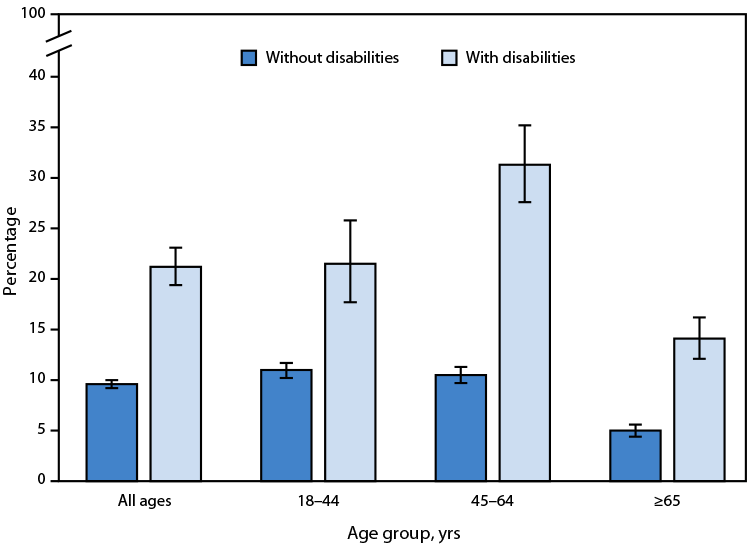
QuickStats: Percentage of Adults Aged ≥18 Years Who Were in Families Having Problems Paying Medical Bills in the Past 12 Months, by Disability Status and Age Group — United States, 2023

In 2023, the percentage of adults aged ≥18 years who were in families having problems paying medical bills in the past 12 months was higher among those with disabilities (21.2%) compared with those without disabilities (9.6%). This pattern was observed across all age groups. Supplementary Table: https://stacks.cdc.gov/view/cdc/164154 Source: National Center for Health Statistics, National Health Interview Read More >
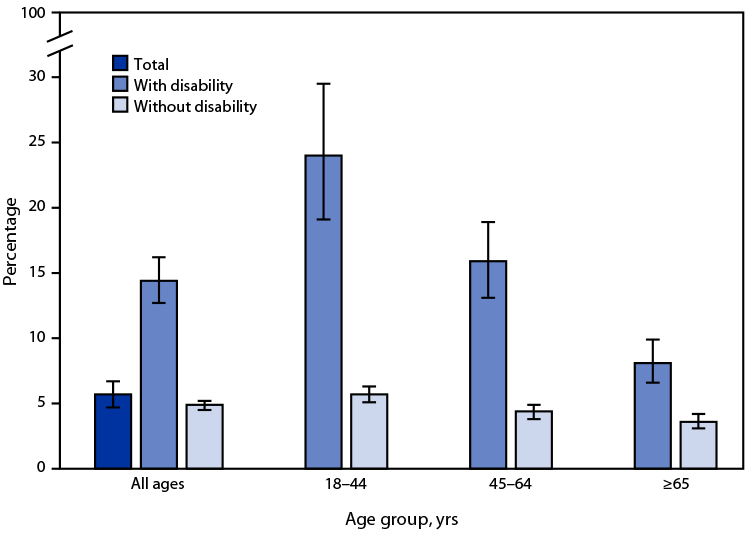
Posted on byQuickStats: Percentage of Adults Aged ≥18 Years Who Lacked Reliable Transportation for Daily Living in the Past 12 Months, by Disability Status and Age Group — National Health Interview Survey, United States, 2022

In 2022, 5.7% of adults aged ≥18 years lacked reliable transportation for daily living in the past 12 months. The percentage lacking reliable transportation for daily living among those with disability was higher (14.4%) compared with those without disability (4.9%). The percentages among persons with disability were higher than percentages among those without disability in Read More >
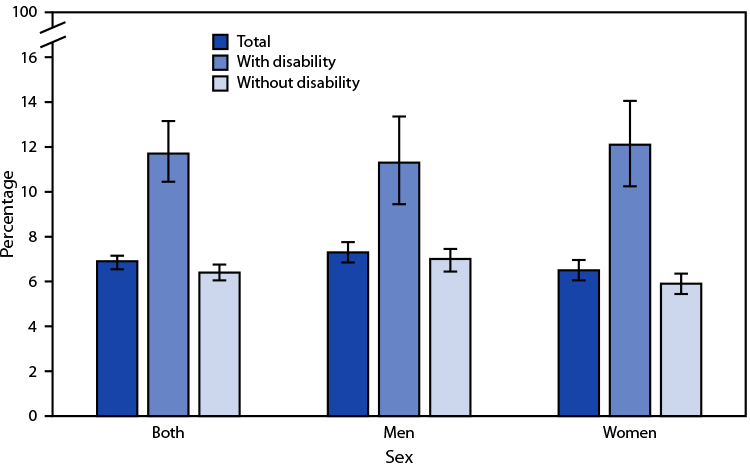
Posted on byQuickStats: Percentage of Adults Aged ≥18 Years Who Rarely or Never Get the Social and Emotional Support They Need, by Sex and Disability Status — National Health Interview Survey, United States, 2021

In 2021, 6.9% of adults aged ≥18 years rarely or never got the social and emotional support they needed. Overall, the percentage was higher among those with a disability (11.7%) than among those without disability (6.4%). Among men, 11.3% of those with disability rarely or never got needed support, compared with 7.0% of those without Read More >
Posted on byQuickStats: Percentage of Adults Aged ≥18 Years with Diagnosed Diabetes, by Disability Status and Age Group — National Health Interview Survey, United States, 2020
In 2020, 25.7% of adults aged ≥18 years with disability had diagnosed diabetes compared with 7.7% of those without disability. For each age group, those with disability were more likely to have diabetes: adults aged 18–44 years (8.3% versus 2.2%), 45–64 years (25.3% versus 9.9%), and ≥65 years (34.2% versus 17.8%). Regardless of disability status, Read More >
Posted on byStressful Life Events Among Children Aged 5–17 Years by Disability Status: United States, 2019
Questions for Heidi Ullman, Health Statistician and Lead Author of “Stressful Life Events Among Children Aged 5–17 Years by Disability Status: United States, 2019.” Q: Why did you decide to do a report on stressful life events for children with a disability? HU: Children with disabilities are an important population group that has experienced disadvantage Read More >
Posted on by
