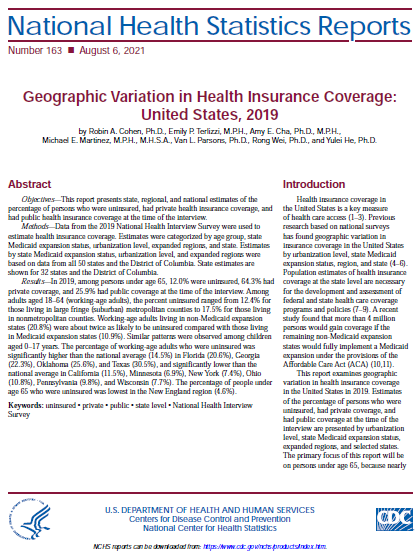
Geographic Variation in Health Insurance Coverage: United States, 2019
Posted on by NCHS releases a new report that presents state, regional, and national estimates of the percentage of persons who were uninsured, had private health insurance coverage, and had public health insurance coverage at the time of the interview.
Key Findings:
- In 2019, among persons under age 65, 12.0% were uninsured, 64.3% had private coverage, and 25.9% had public coverage at the time of the interview.
- Among adults aged 18–64 (working-age adults), the percent uninsured ranged from 12.4% for those living in large fringe (suburban) metropolitan counties to 17.5% for those living in nonmetropolitan counties.
- Working-age adults living in non-Medicaid expansion states (20.8%) were about twice as likely to be uninsured compared with those living in Medicaid expansion states (10.9%). Similar patterns were observed among children
aged 0–17 years. - The percentage of working-age adults who were uninsured was significantly higher than the national average (14.5%) in Florida (20.6%), Georgia (22.3%), Oklahoma (25.6%), and Texas (30.5%), and significantly lower than the national average in California (11.5%), Minnesota (6.9%), New York (7.4%), Ohio (10.8%), Pennsylvania (9.8%), and Wisconsin (7.7%).
- The percentage of people under age 65 who were uninsured was lowest in the New England region (4.6%).
Posted on by
Categories health insurance
Page last reviewed: August 6, 2021
Page last updated: August 6, 2021
Content source:
CDC, National Center for Health Statistics

