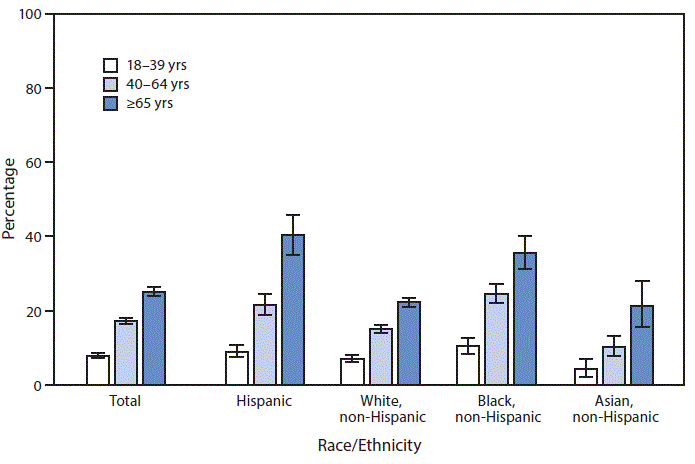
QuickStats: Percentage of Adults in Fair or Poor Health, by Age Group and Race and Ethnicity
Posted on byIn 2019, the percentage of adults in fair or poor health increased by age (7.8% for those aged 18–39 years, 17.2% for those 40–64 years, and 25.1% for those ≥65 years) and for each racial/ethnic group shown.
Hispanic and non-Hispanic Black adults were most likely to be in fair or poor health in each age group.
Among persons aged 18–39 and 40–64 years, non-Hispanic Asian adults were least likely to be in fair or poor health.
Among persons aged ≥65 years, non-Hispanic Asian and non-Hispanic White adults were least likely to be in fair or poor health.
Hispanic and non-Hispanic Black adults aged ≥65 years had the highest percentages of fair or poor health (40.3% and 35.5%, respectively), and non-Hispanic Asian adults aged 18–39 years had the lowest percentage of fair or poor health (4.1%).
Source: National Center for Health Statistics, National Health Interview Survey, 2019 data. https://www.cdc.gov/nchs/nhis.htm
Posted on by


