Drug Poisoning Mortality: United States, 1999-2015
Posted on by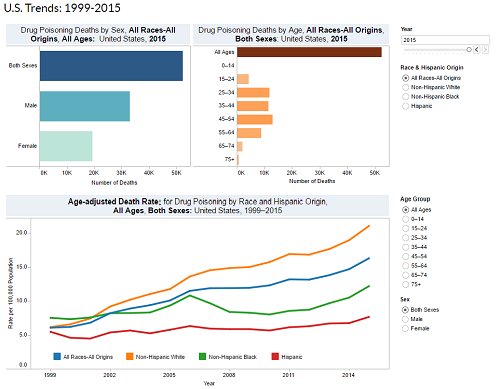
The CDC’s National Center for Health Statistics (NCHS) has released a new data visualization storyboard that presents drug poisoning deaths from 1999 to 2015 at the national, state, and county levels.
The first two dashboards depict U.S. and state trends in age-adjusted death rates for drug poisoning from 1999 to 2015 by selected demographic characteristics, and the third dashboard presents a series of heat maps of model-based county estimates for drug poisoning mortality from 1999 to 2015.
https://www.cdc.gov/nchs/data-visualization/drug-poisoning-mortality/
Posted on by
Page last reviewed: April 19, 2017
Page last updated: April 19, 2017
Content source:
CDC, National Center for Health Statistics