Mortality in the United States, 2015
Posted on by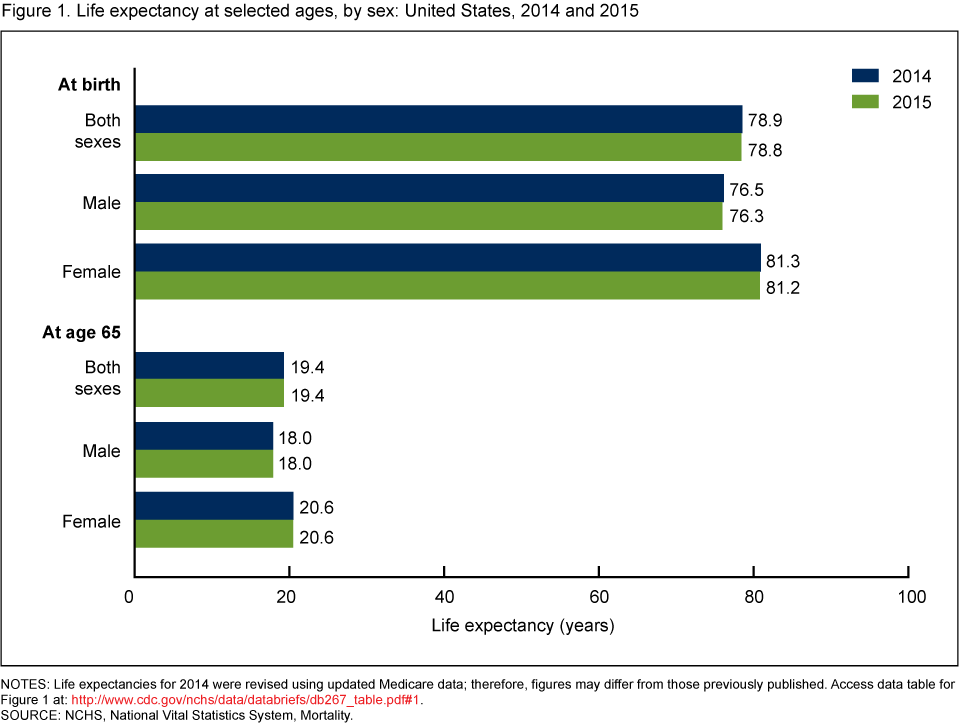
Questions for Jiaquan Xu, Epidemiologist and Lead Author on “Mortality in the United States, 2015.”
Q: Is it true that death rates in the U.S. have been increasing over the past few years?
JX: Not exactly. The age-adjusted death rate for total US population increased 1.2% from 724.6 per 100,000 standard population in 2014 to 733.1 in 2015. This was the first significant increase since 1999. We have seen the decrease in mortality for most race/ethnic groups in most of years since 2006. Especially the rates decreased significantly for all male, all female, non-Hispanic white male, non-Hispanic white female, non-Hispanic black male, non-Hispanic black female, Hispanic male, and Hispanic female in 2014 from 2013.
Q: What are some of the reasons why the death rate increased between 2014 and 2015?
JX: We don’t know exactly what caused the increase in mortality in the United States from 2014 to 2015. The results have shown that the age-adjusted death rates increased for 8 (heart disease, chronic lower respiratory, unintentional injuries, stroke, Alzheimer’s disease, diabetes, kidney disease, and suicide) of the 10 leading causes of death. Only decrease in mortality among 10 leading causes of death in 2015 from 2014 was for cancer. Death rates increased significantly for 20 states and decreased for 1. The change for the rest of states were not significant.
Q: Do your findings for 2015 suggest we have reached a peak as far as increases in life expectancy goes?
JX: We don’t think we have reached a peak in life expectancy. Many people died of non-age-related causes because they have aged. Those deaths are preventable. For example, there are 146,571 deaths caused by accidents which accounted for 5.4% of total deaths in 2015. About 65% of deaths from these unintentional injuries were those aged under 65. Among accidental deaths, unintentional poisoning accounted for 32.4 % and motor vehicle traffic accidents accounted for 24.5%. We also don’t know if the increase in mortality in 2015 will continue in 2016. But preliminary data have shown that the mortality for most of the 10 leading causes of death in 2015 went down in second quarter from first quarter, 2016 (http://www.cdc.gov/nchs/products/vsrr/mortality-dashboard.htm#trends). But it is too early to say that the mortality in 2016 will go down or continue going up. We will see what happens when the 2016 final file is available.
Q: What accounts for the decline in life expectancy at birth in 2015 from 2014?
JX: For the total US population, life expectancy decreased 0.1 year from 78.9 years in 2014 to 78.8 in 2015, mainly because of increases in mortality from the 13 causes of death among the 15 leading causes of death, such as heart disease, chronic lower respiratory disease, unintentional injuries, stroke, Alzheimer’s disease, diabetes, kidney disease, suicide, septicemia, , chronic liver disease, hypertension, Parkinson’s disease, and pneumonitis due to solids and liquids. From 2014 to 2015, life expectancy decreased 0.1 year for females largely because of increases in mortality from 12 of 15 leading causes of death such as heart disease, chronic lower respiratory disease, stroke, Alzheimer’s disease, unintentional injuries, influenza and pneumonia, septicemia, hypertension, chronic liver disease, Parkinson’s disease, suicide, and pneumonitis due solids and liquids. The deaths from those 12 leading causes of death accounted for 52.9% of total female deaths.
Life expectancy declined 0.2 year for males largely because of increases in mortality from 11 of 15 leading causes of death such as unintentional injuries, chronic lower respiratory disease, stroke, diabetes, suicide, Alzheimer’s disease, chronic liver disease, septicemia, Parkinson’s disease, Homicide, and hypertension. And about 65% of accidental deaths were under 65 years old, while 81% of suicides were aged 15-64, and 95% of homicides were under 65 years. More young people dying from preventable causes drags life expectancy down.
Q: Is it unusual that mortality rates for so many leading causes of death increased in 2015?
JX: We haven’t seen the increase in mortality from so many leading causes of death for a long time. The age-adjusted death rates increased significantly for 3 of 10 leading causes of death in 2014, 2 in 2013, 1 in 2012, and 5 in 2011. It is an unusual year. Again we don’t know why.
Q: Does the increase in mortality among white females suggest another drop in life expectancy for that group?
JX: We don’t have life expectancy numbers for white females yet. It is possible that the life expectancy numbers in 2015 for white women will drop again in 2015 since the life expectancy decreased 0.1 year for all females in 2015 from 2014 and mortality from 12 of 15 leading causes of death for white females increased significantly in 2015 from 2014 (heart disease, chronic lower respiratory diseases, Alzheimer’s disease, stroke, unintentional injuries, diabetes, influenza and pneumonia, hypertension, chronic liver disease, Parkinson’s disease, suicide, pneumonitis due to solids and liquids).
Posted on by