Teen Birth Rates for Urban and Rural Areas in the United States, 2007–2015
Posted on by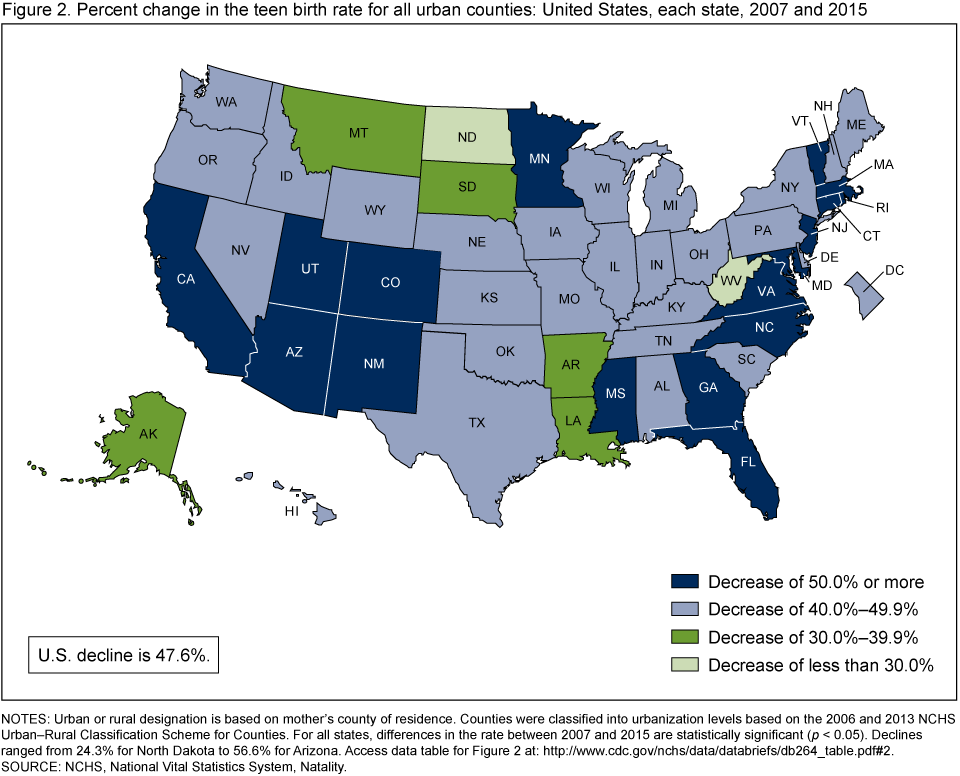
Questions for Brady Hamilton, Statistician and Lead Author of “Teen Birth Rates for Urban and Rural Areas in the United States, 2007–2015”
Q: Are teen birth rates in the U.S. higher in urban areas or rural areas?
BH: The birth rate for teenagers is higher in rural areas than in urban areas. In 2015, the rate was 30.9 births per 1,000 females aged 15-19 for rural areas compared with 20.9 for urban areas. This difference persisted over the duration of the study, from 2007 through 2015, and was seen in the teen birth rates for non-Hispanic white, non-Hispanic black, and Hispanic females.
Q: What explains the differences or similarities in the two areas?
BH: The data on which the report is based comes from the birth certificates filed in all states and DC. While the data from the birth certificate provide detailed information on a number of topics, this report did not examine reasons for urban/rural differences, as information on many contributing factors is not available from the birth certificate.
However, the report shows that while the birth rate for teenagers is higher in rural areas than in urban areas, birth rates for all areas declined from 2007 through 2015, down 50% in large urban, 44% in medium and small urban, and 37% in rural areas.
Q: What were some of the regional differences you observed in teen birth rates in urban or rural areas?
BH: The urban teen birth rate declined for all states and DC between 2007 and 2015, with declines ranging from 24% for teens in North Dakota to 57% for teens in Arizona, whereas the rural teen birth rate declined for in nearly all states, with declines ranging from 18% for teens in Alaska to 73% for teens in Connecticut.
Among the urban areas, states with the largest declines (50% or more in the teen birth rate) include: Arizona, California, Colorado, Connecticut, Florida, Georgia, Maryland, Massachusetts, Minnesota, Mississippi, New Jersey, New Mexico, North Carolina, Rhode Island, Utah, Vermont, and Virginia.
Among the rural areas, states with the largest declines (50% or more in the teen birth rate) include: Colorado and Connecticut.
Q: Are there any data which suggests sexual activity among teens is higher in urban vs. rural areas – or vice versa?
BH: As noted, information is not available from the birth certificate on the attitudes and behavior of the parents associated with fertility and family formation.
Q: What are the differences in teen birth rates among race/ethnic groups and are there different patterns among these groups depending on whether they live in urban or rural areas?
BH: Teen birth rates for non-Hispanic white, non-Hispanic black, and Hispanic females were highest in rural counties and lowest in large urban areas in 2015.
For each area, the teen birth rate was consistently highest for Hispanic females and consistently lowest for non-Hispanic white females.
The difference in the teen birth rate between rural and large urban areas was lowest for non-Hispanic black females and greatest for non-Hispanic white females.
Q: Which U.S. counties have the highest teen birth rate and which counties have the lowest?
A: Teen birth rates are not available for individual counties in the report. Counties are grouped into areas according to their urban or rural designation and the teen birth rate was reported for an area based on the aggregated data of the counties for the area.
Posted on by