Visualizing Ohio Workers’ Compensation Claims by Event/Exposure
Posted on by
Research has shown that large state datasets of workers’ compensation (WC) claims can be successfully linked to state employment data to examine claim counts and rates by industry and cause of injury.1-6 This can give us better insight into industry trends, helping to focus attention towards areas where employers and workers would benefit most from occupational safety and health interventions. NIOSH and the Ohio Bureau of Workers’ Compensation (OHBWC) collaborated to publish one of these studies that analyzed WC claims among private employers insured by the state. 7
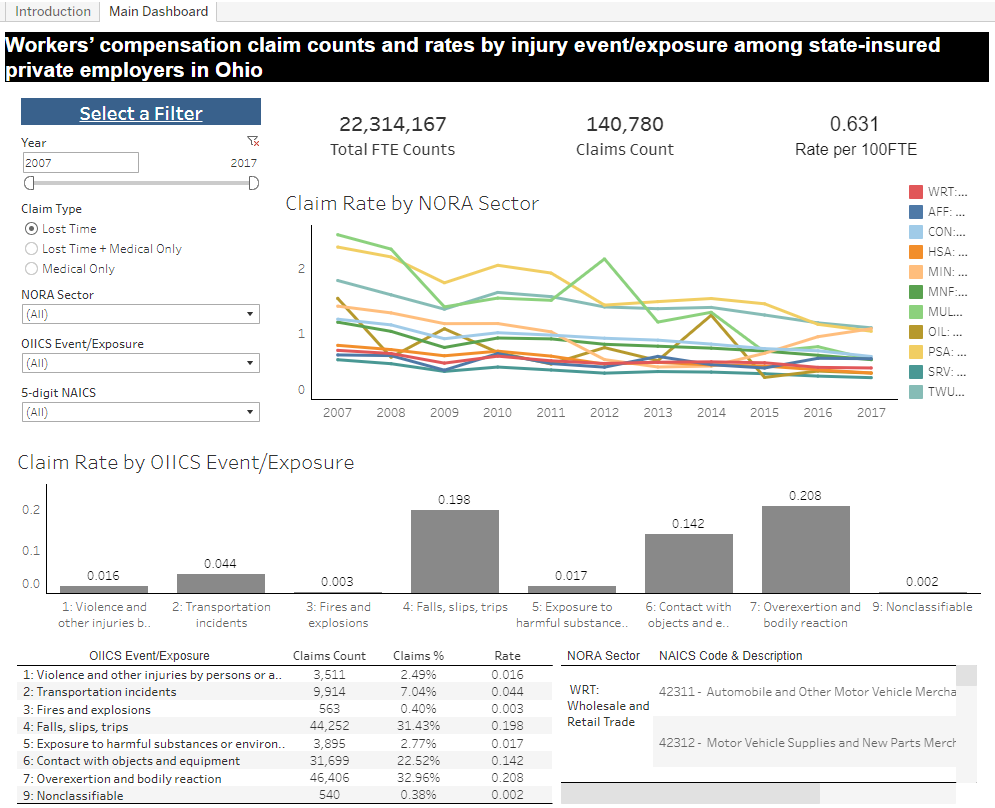
The study analyzed 140,780 lost-time claims and 633,373 medical-only claims from 2007-2017 and identified the event or exposure that led to each claim. The immediate goal of the study was to produce information that OHBWC-insured employers can use to benchmark their safety and health performance against industry peers and develop data-driven plans for prevention. This information can help focus safety and health efforts. In conjunction with the study, NIOSH also recently released an accompanying Tableau data visualization dashboard to make this information more readily available and useful.
The data visualization dashboard was designed to allow a larger audience to understand the data more easily and develop quicker conclusions and solutions. Safety and health practitioners and researchers can also use these data to understand industry risk trends and tailor safety, health, and disability prevention services for efficient allocation of resources. Ultimately, both the study results and the dashboard can contribute to protecting workers and reducing the frequency and cost of work-related injuries and illnesses in Ohio and nationally.
Users can now filter through various industries, claim types, and injury/illness event/exposures. The dataset includes accepted lost-time claims (8 or more days away from work) and medical-only claims (medical care only and/or 7 or fewer days away from work).
Although counts and rates of lost-time WC claims declined from 2007-2017, the leading lost-time injury event/exposures remained largely unchanged each year:
- Overexertion and Bodily Reaction (33%)
- Falls, Slips, and Trips (31%)
- Contact with Objects and Equipment (23%)
- Transportation Incidents (7%)
- Exposure to Harmful Substances or Environments (3%)
- Violence and Other Injuries by Persons or Animals (3%)
- Fires and Explosions (0.4%).
The proportions of injury event/exposures varied by industry and higher-risk industries were identified. While overall injuries have declined, certain industries face specific prevention challenges. Users are encouraged to use the dashboard to explore these differences.
We are interested in your experience with and opinions on this and other occupational safety and health data visualization dashboards. Please let us know what you think below.
Nhut Nguyen, MPH; Steven J. Wurzelbacher, PhD; Alysha R. Meyers, PhD; Stephen J. Bertke, PhD; and Chih-Yu Tseng, MS, are with the National Institute for Occupational Safety and Health’s (NIOSH) Division of Field Studies and Engineering.
P. Timothy Bushnell, PhD, MPA, is with the NIOSH Office of the Director.
Michael P. Lampl, MS; David C. Robins, AAS; and Steven J. Naber, PhD, are with the Ohio Bureau of Workers Compensation.
More Information
NIOSH Center for Workers’ Compensation Studies (CWCS)
- Contact: cwcs@cdc.gov
Ohio Bureau of Workers’ Compensation (Ohio Bureau)
- Contact: Steven J. Naber, steven.n.1@bwc.ohio.gov
References
1) Michigan Department of Health and Human Services. MiTracking Program 2020. https://mitracking.state.mi.us. Accessed October 2, 2023.
2) Harrison R, Shor G, Jackson R, et al. 2019. California Workers’ Compensation Surveillance. California Department of Public Health and California Department of Industrial Relations. Grant Number: 6 U60OH010895. Grant/Cooperative Agreement Project Period: 6/1/2015 – 5/31/2019. Report Date: August 31, 2019.
3) Taylor EL, Higgins TA, Jones MW, Wagner JP. Utilization of Tennessee Workers’ Compensation Data for Injury Surveillance and Prevention 2014 – 2016, Technical Report July 2019. The University of Tennessee, Knoxville; Construction Industry Research and Policy Center and Vanderbilt University; Center for Medicine Health and Society.
4) Massachusetts Department of Industrial Accidents, Massachusetts Department of Public Health Occupational Health Surveillance Program, Massachusetts Department of Labor Standards Occupational Safety and Health Statistics Program. Using Massachusetts Workers’ Compensation Data to Identify Priorities for Preventing Occupational Injuries and Illnesses among Private Sector Workers Findings from an Analysis of Massachusetts Workers’ Compensation Lost Wage Claims, 2014-2016. https://www.mass.gov/doc/dph-dia-and-dls-release-new-study-on-utilization-of-workers-compensation-data/download. Accessed October 2, 2023.
5) Wurzelbacher SJ, Al-Tarawneh IS, Meyers AR et al. Development of methods for using workers’ compensation data for surveillance and prevention of occupational injuries among State-insured private employers in Ohio. Am J Ind Med. 2016;59(12):1087-1104. https://doi.org/10.1002/ajim.22653
6) Anderson NJ, Bonauto DK, Adams D. Prioritizing industries for occupational injury and illness prevention and research, Washington State Workers’ Compensation Claims Data, 2002–2010. Washington State Department of Labor and Industries Technical Report Number 64-1-2013. https://lni.wa.gov/safety-health/safety-research/files/2013/bd_3F.pdf. Accessed October 2, 2023.
7) Wurzelbacher SJ, Meyers AR, Lampl MP, Timothy Bushnell P, Bertke SJ, Robins DC, Tseng CY, Naber SJ. Workers’ compensation claim counts and rates by injury event/exposure among state-insured private employers in Ohio, 2007-2017. J Safety Res. 2021 Dec;79:148-167. https://doi.org/10.1016/j.jsr.2021.08.015
Posted on by