American Indian and Alaska Native Workers
Posted on by
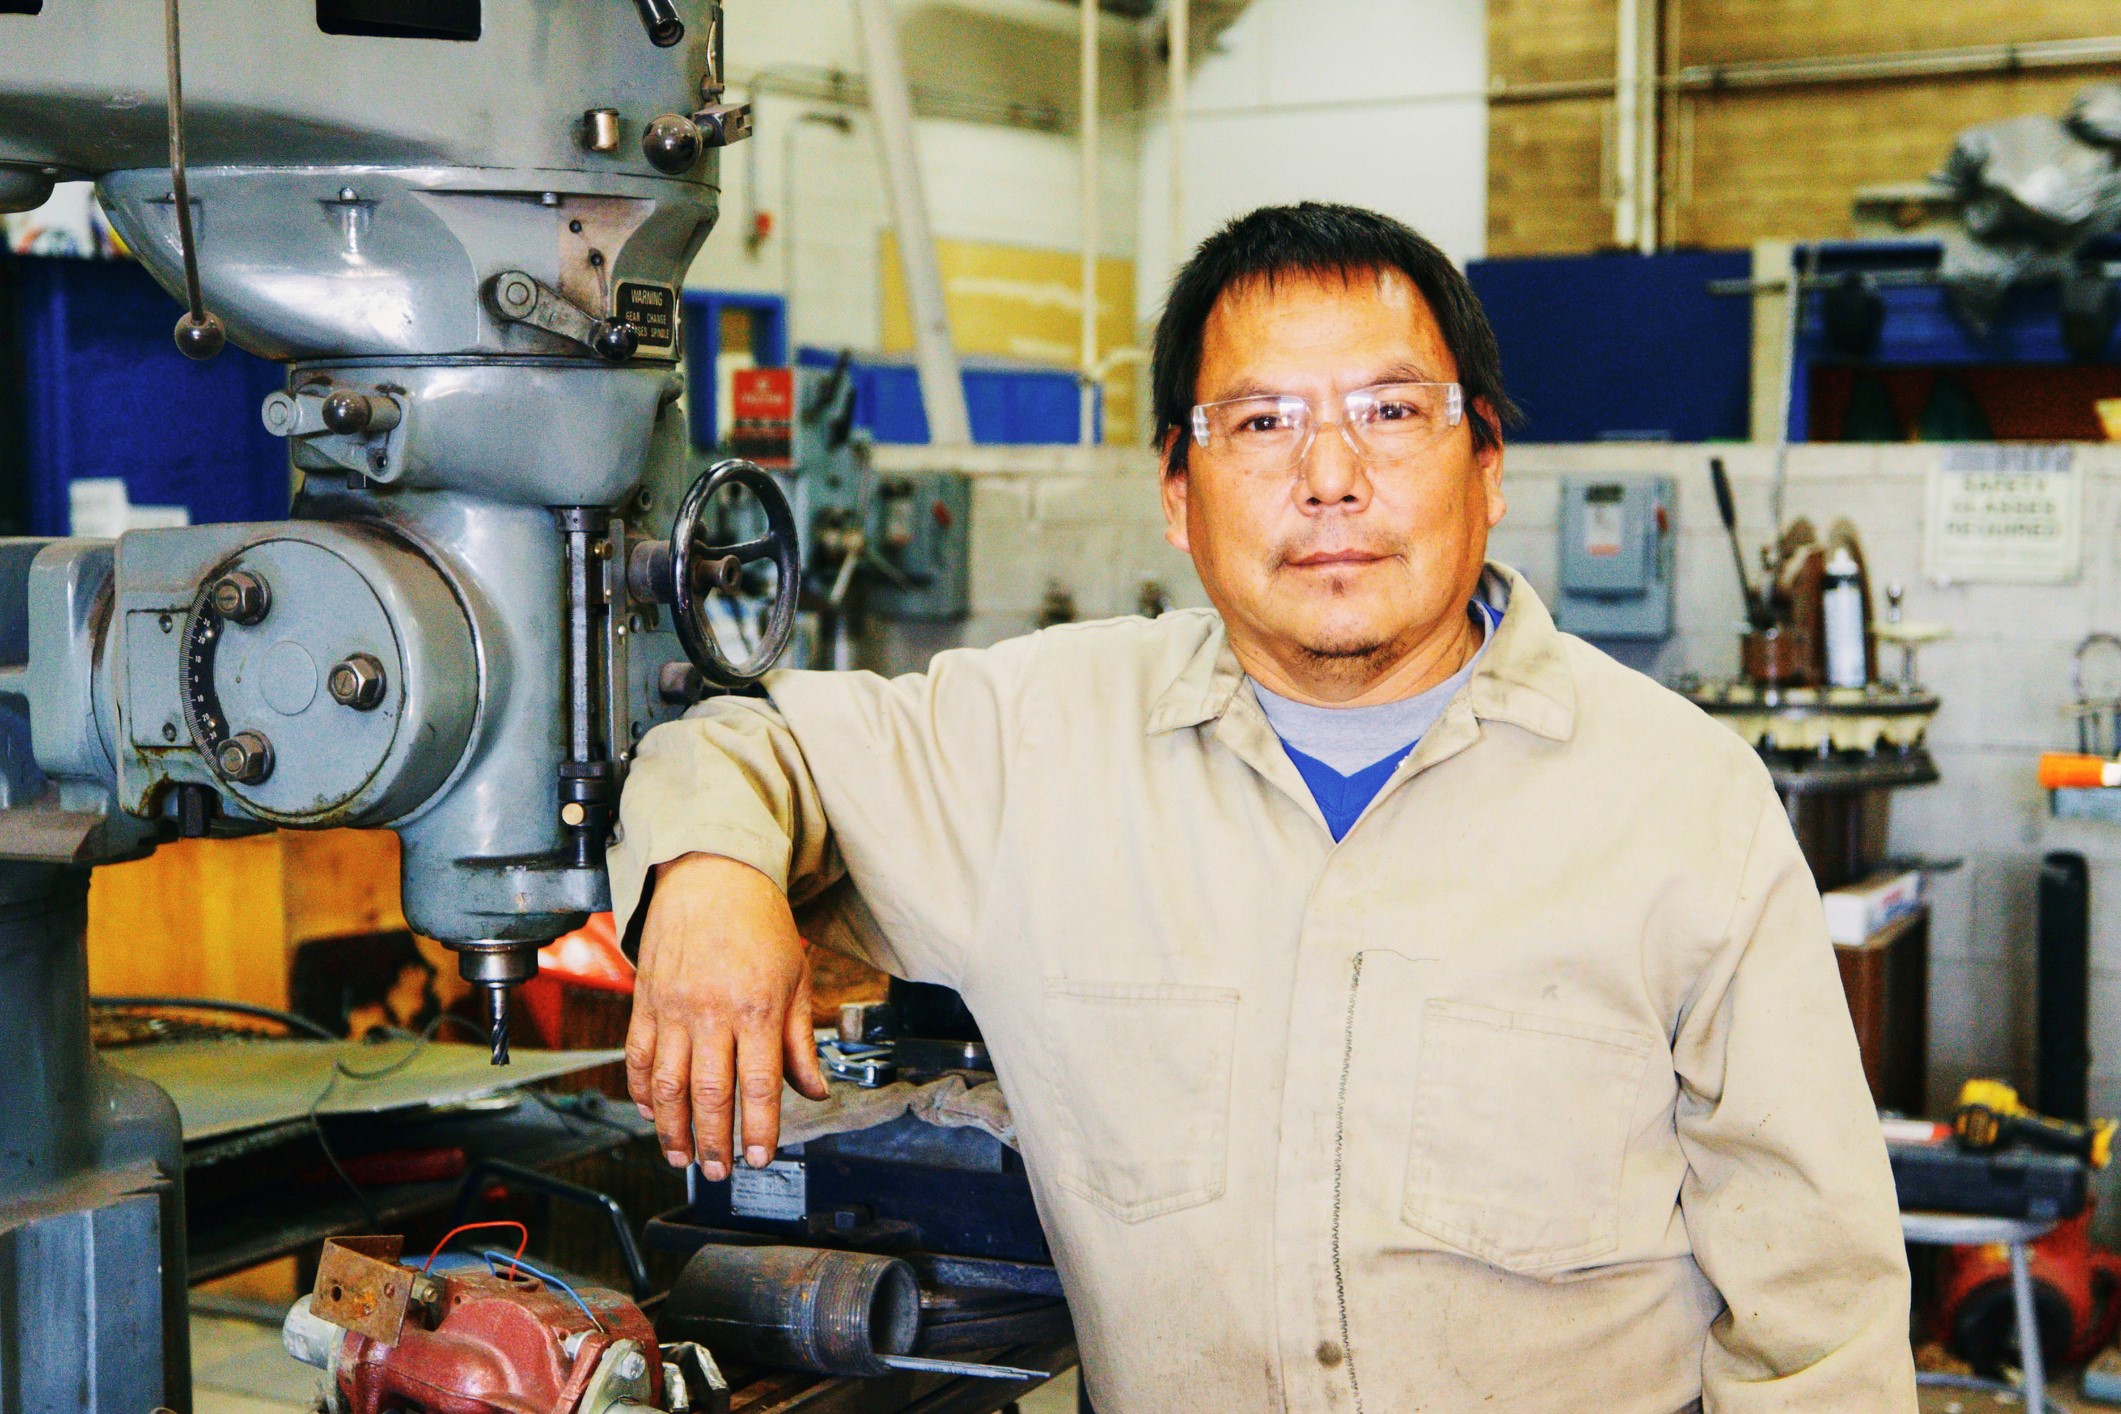 This is the second blog post in our series celebrating Native American Heritage Month. It provides a general description of the American Indian and Alaska Native (AI/AN) workforce using the NIOSH Employed Labor Force (ELF) Query System. Read the first blog post here.
AI/AN workers are employed in various occupations and industries. Understanding where many AI/AN people work will help focus efforts to enhance workplace safety and health where AI/AN workers are employed.
Why is it important to learn about what people do in their job?
Some occupations and industries carry a higher risk of hazards, injuries, or illnesses.
- Occupation refers to a person’s job or what they do on the job. A few examples are registered nurses, janitors, cashiers, and servers.
- Industry is the kind of business of the employer or what the employer does. A few examples are general hospitals, elementary schools, clothing manufacturing, and restaurants.
Just as each occupation may have hazards, each industry may have different situations that could put an employee at risk for different work-related conditions.
Work influences many aspects of life that affect health. These include income, workplace hazards, healthcare access, housing, and more. Knowing a person’s occupation and industry can help understand their workplace exposures and work-related stressors.
The AI/AN workforce today
Using the NIOSH Employed Labor Force (ELF) Query System, we viewed data related to occupation and industry among AI/AN workers. ELF provides employed worker population estimates using data from a subset of the Current Population Survey (CPS) public access data files. The U.S. Bureau of the Census administers the CPS for the Bureau of Labor Statistics.
Based on the 2022 CPS data, in the United States:
- Over 1.7 million workers identified only as AI/AN (“AI/AN alone”).[1] This number increases to over 2.8 million workers if we include workers who identified as AI/AN in combination with any other race.[2]
- 68% of all AI/AN (includes both “AI/AN alone” and “AI/AN in combination with any other race”) worked full-time.
- 74% of all AI/AN (includes both “AI/AN alone” and “AI/AN in combination with any other race”) worked in the private sector.
By Indian Health Service Regions
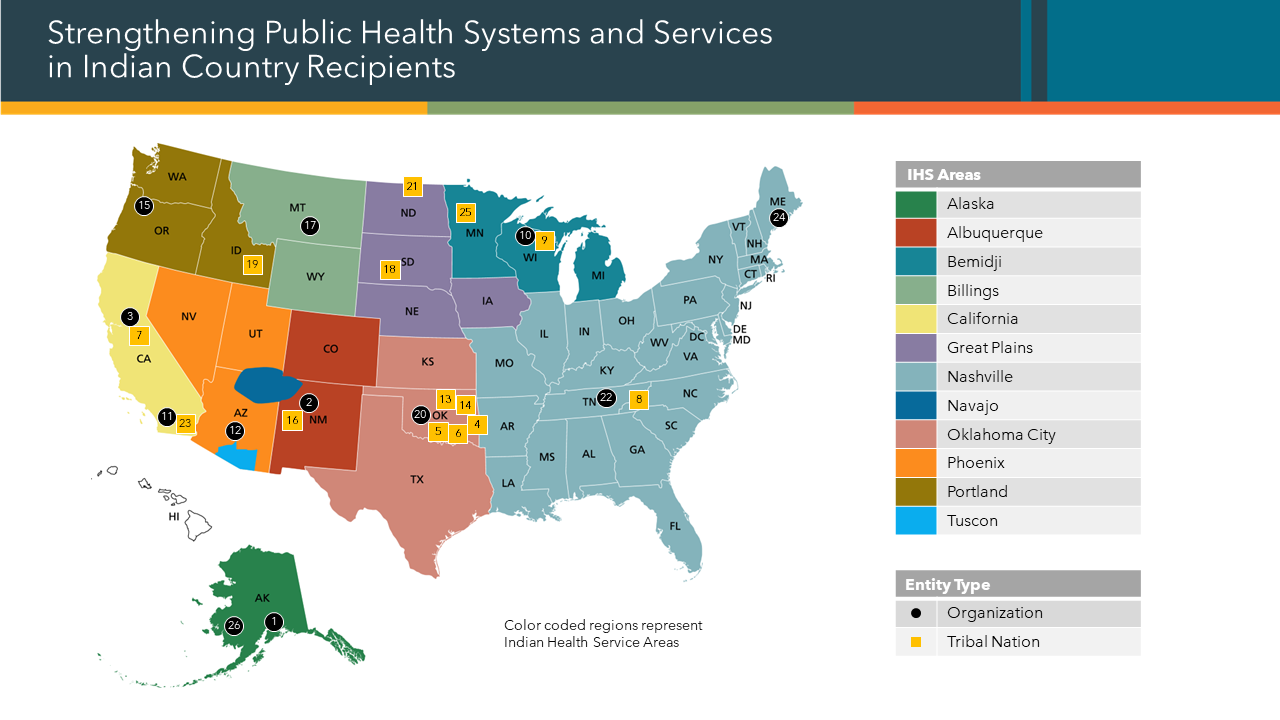
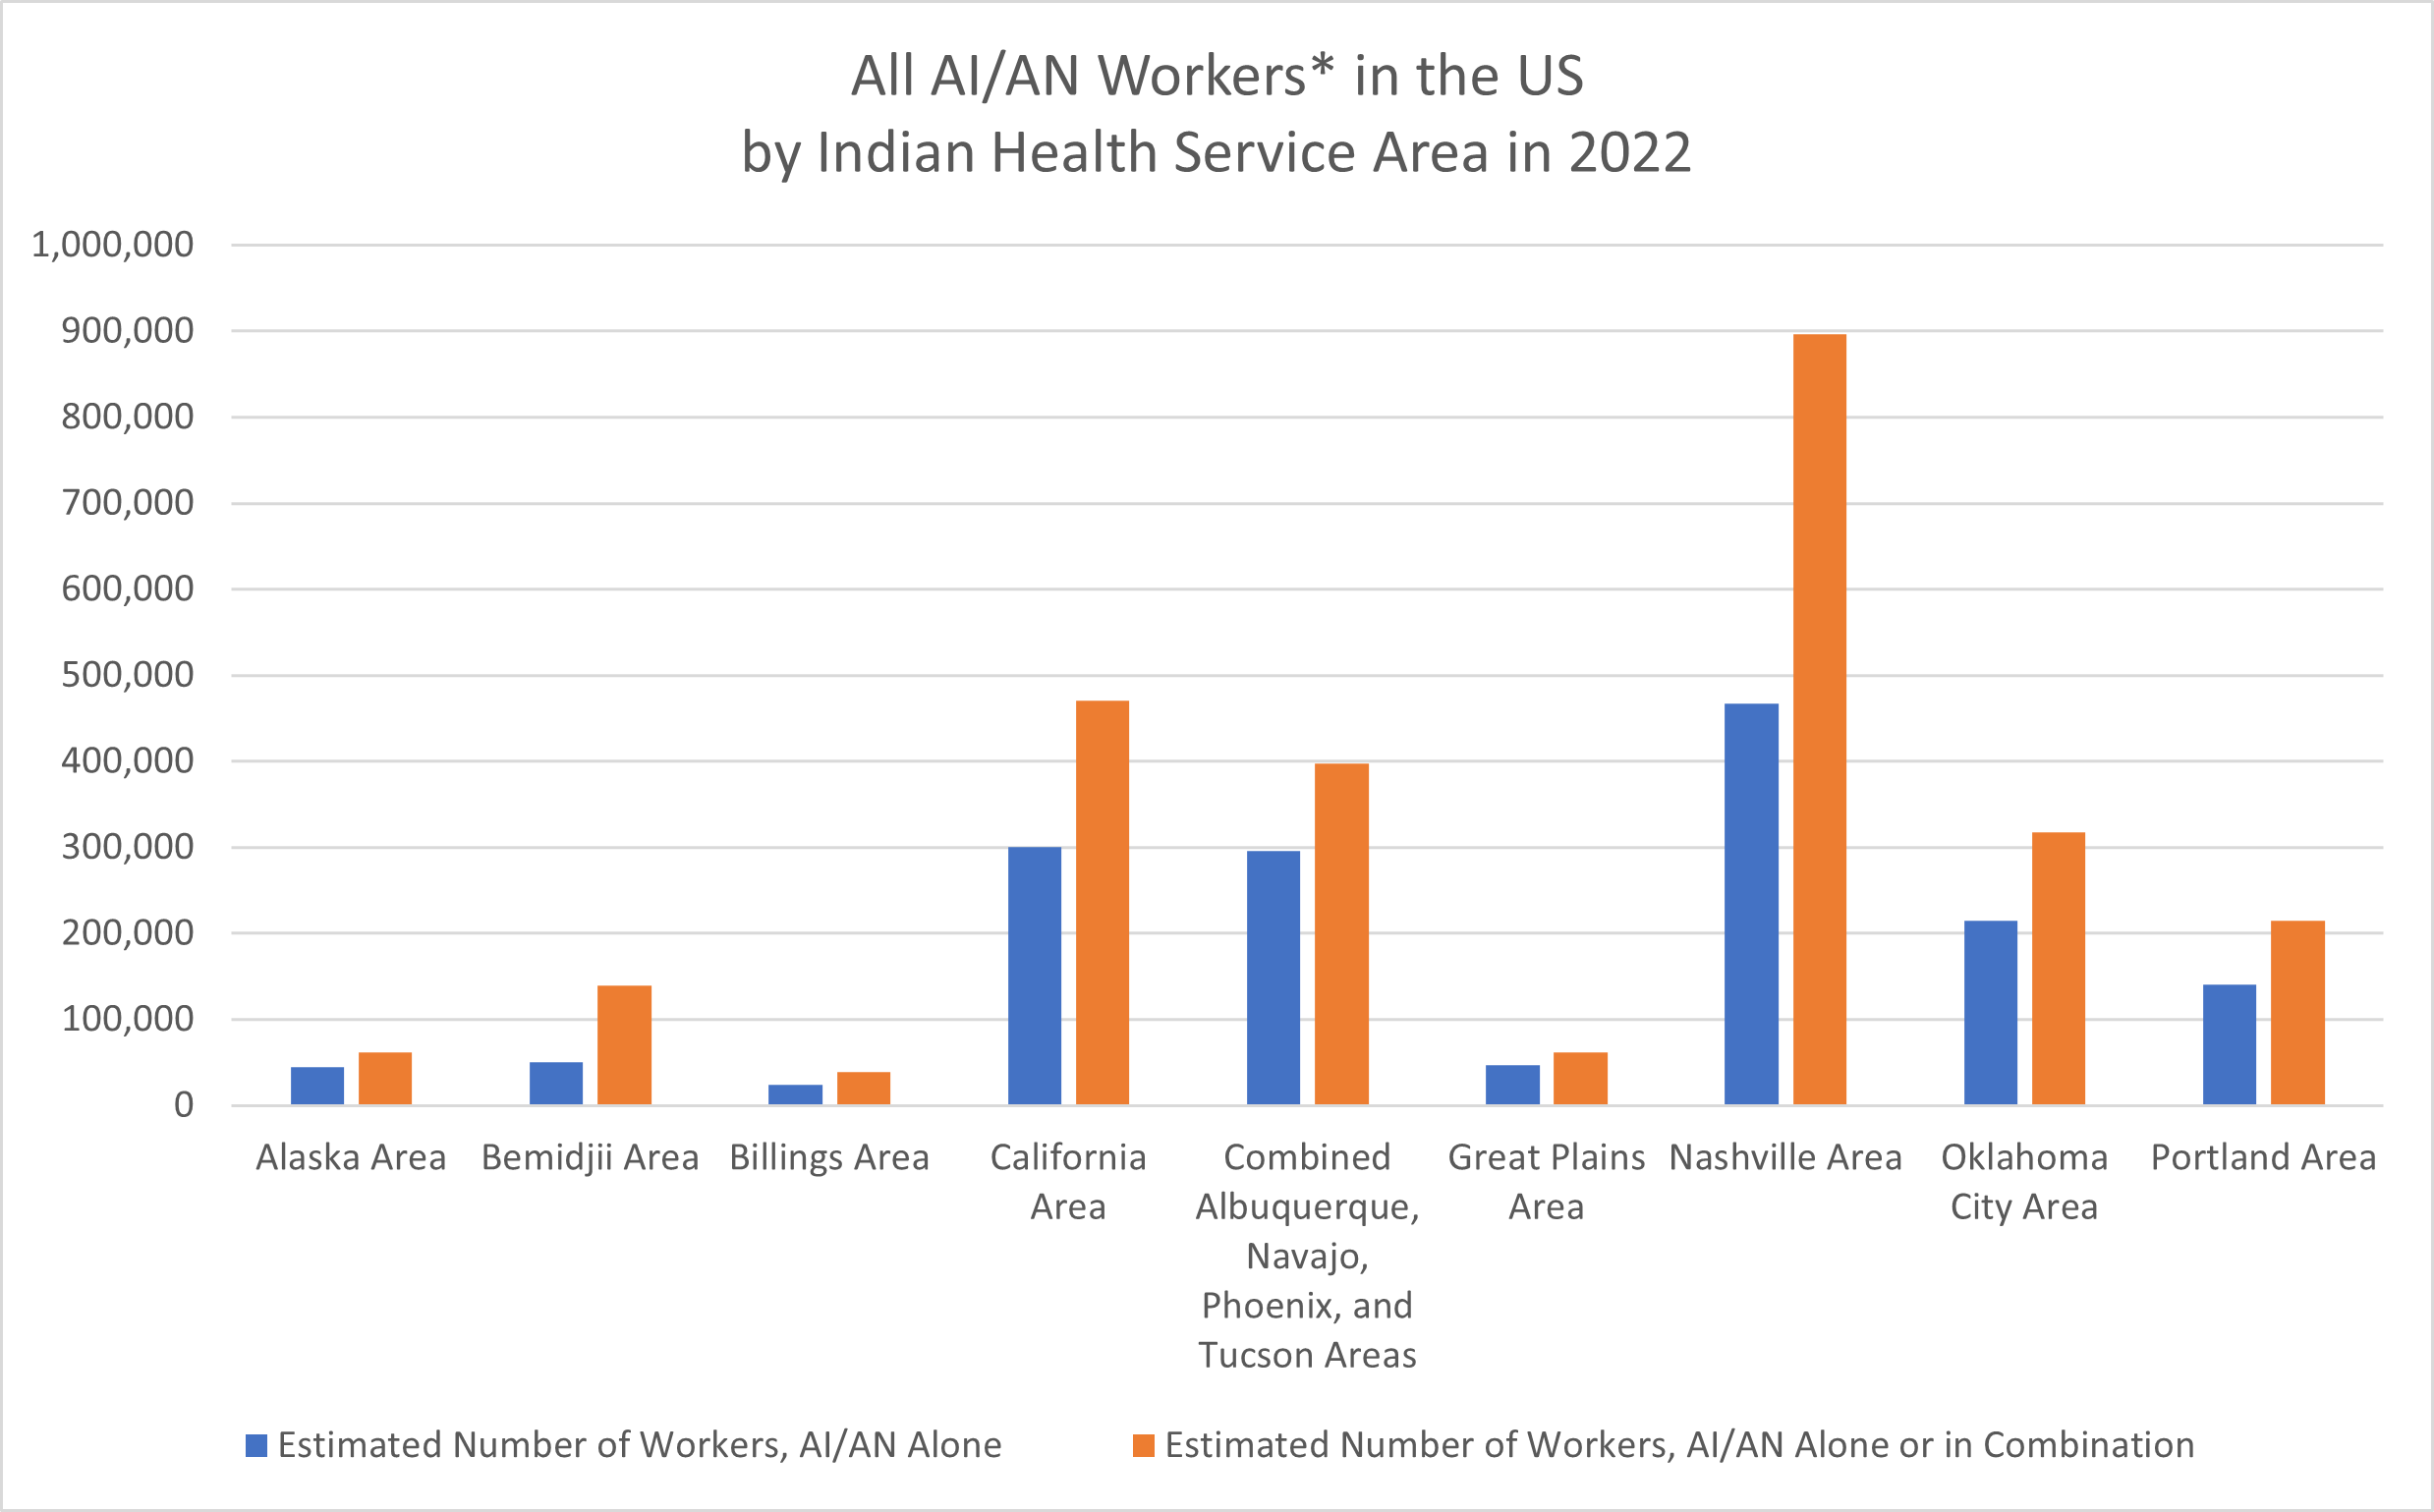
The Indian Health Service (IHS) is divided into twelve physical areas across the United States. Each IHS area has a unique group of tribes they work with regularly. Using ELF, we viewed the number of AI/AN workers by Indian Health Service (IHS) regions. These regions include Alaska, Albuquerque, Bemidji, Billings, California, Great Plains, Nashville, Navajo, Oklahoma, Phoenix, Portland, and Tucson.
By Occupation and Industry
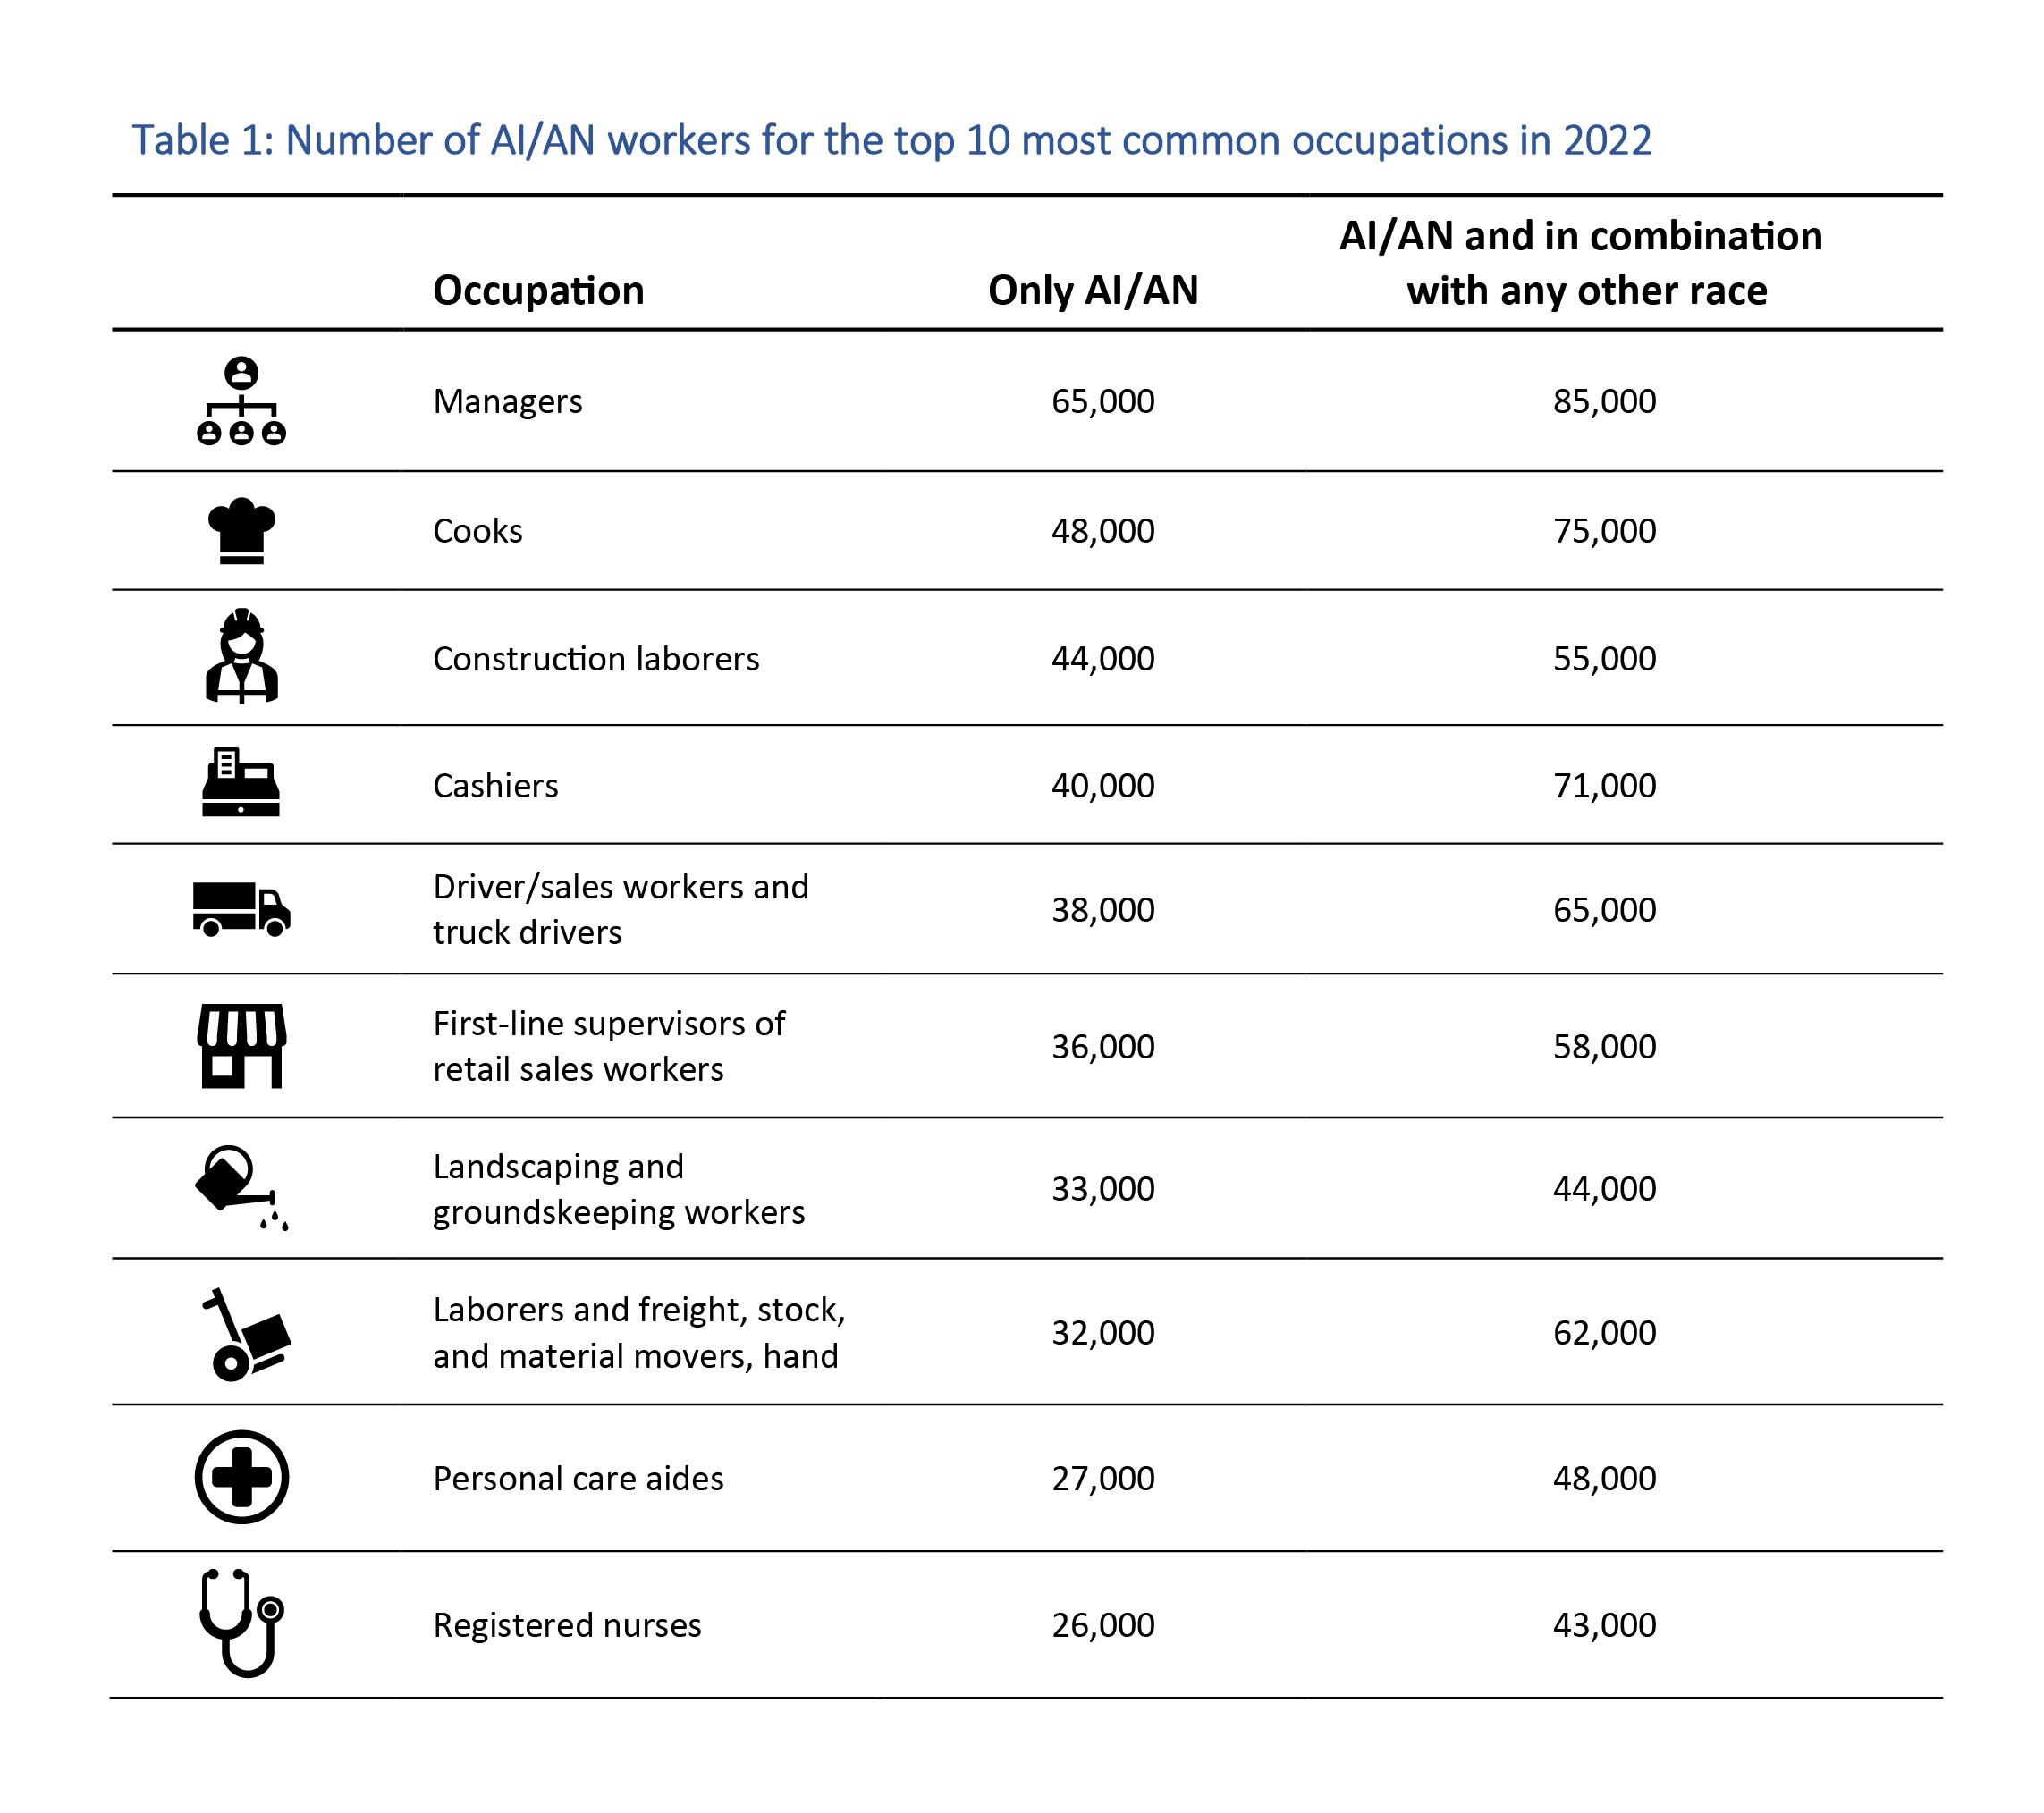
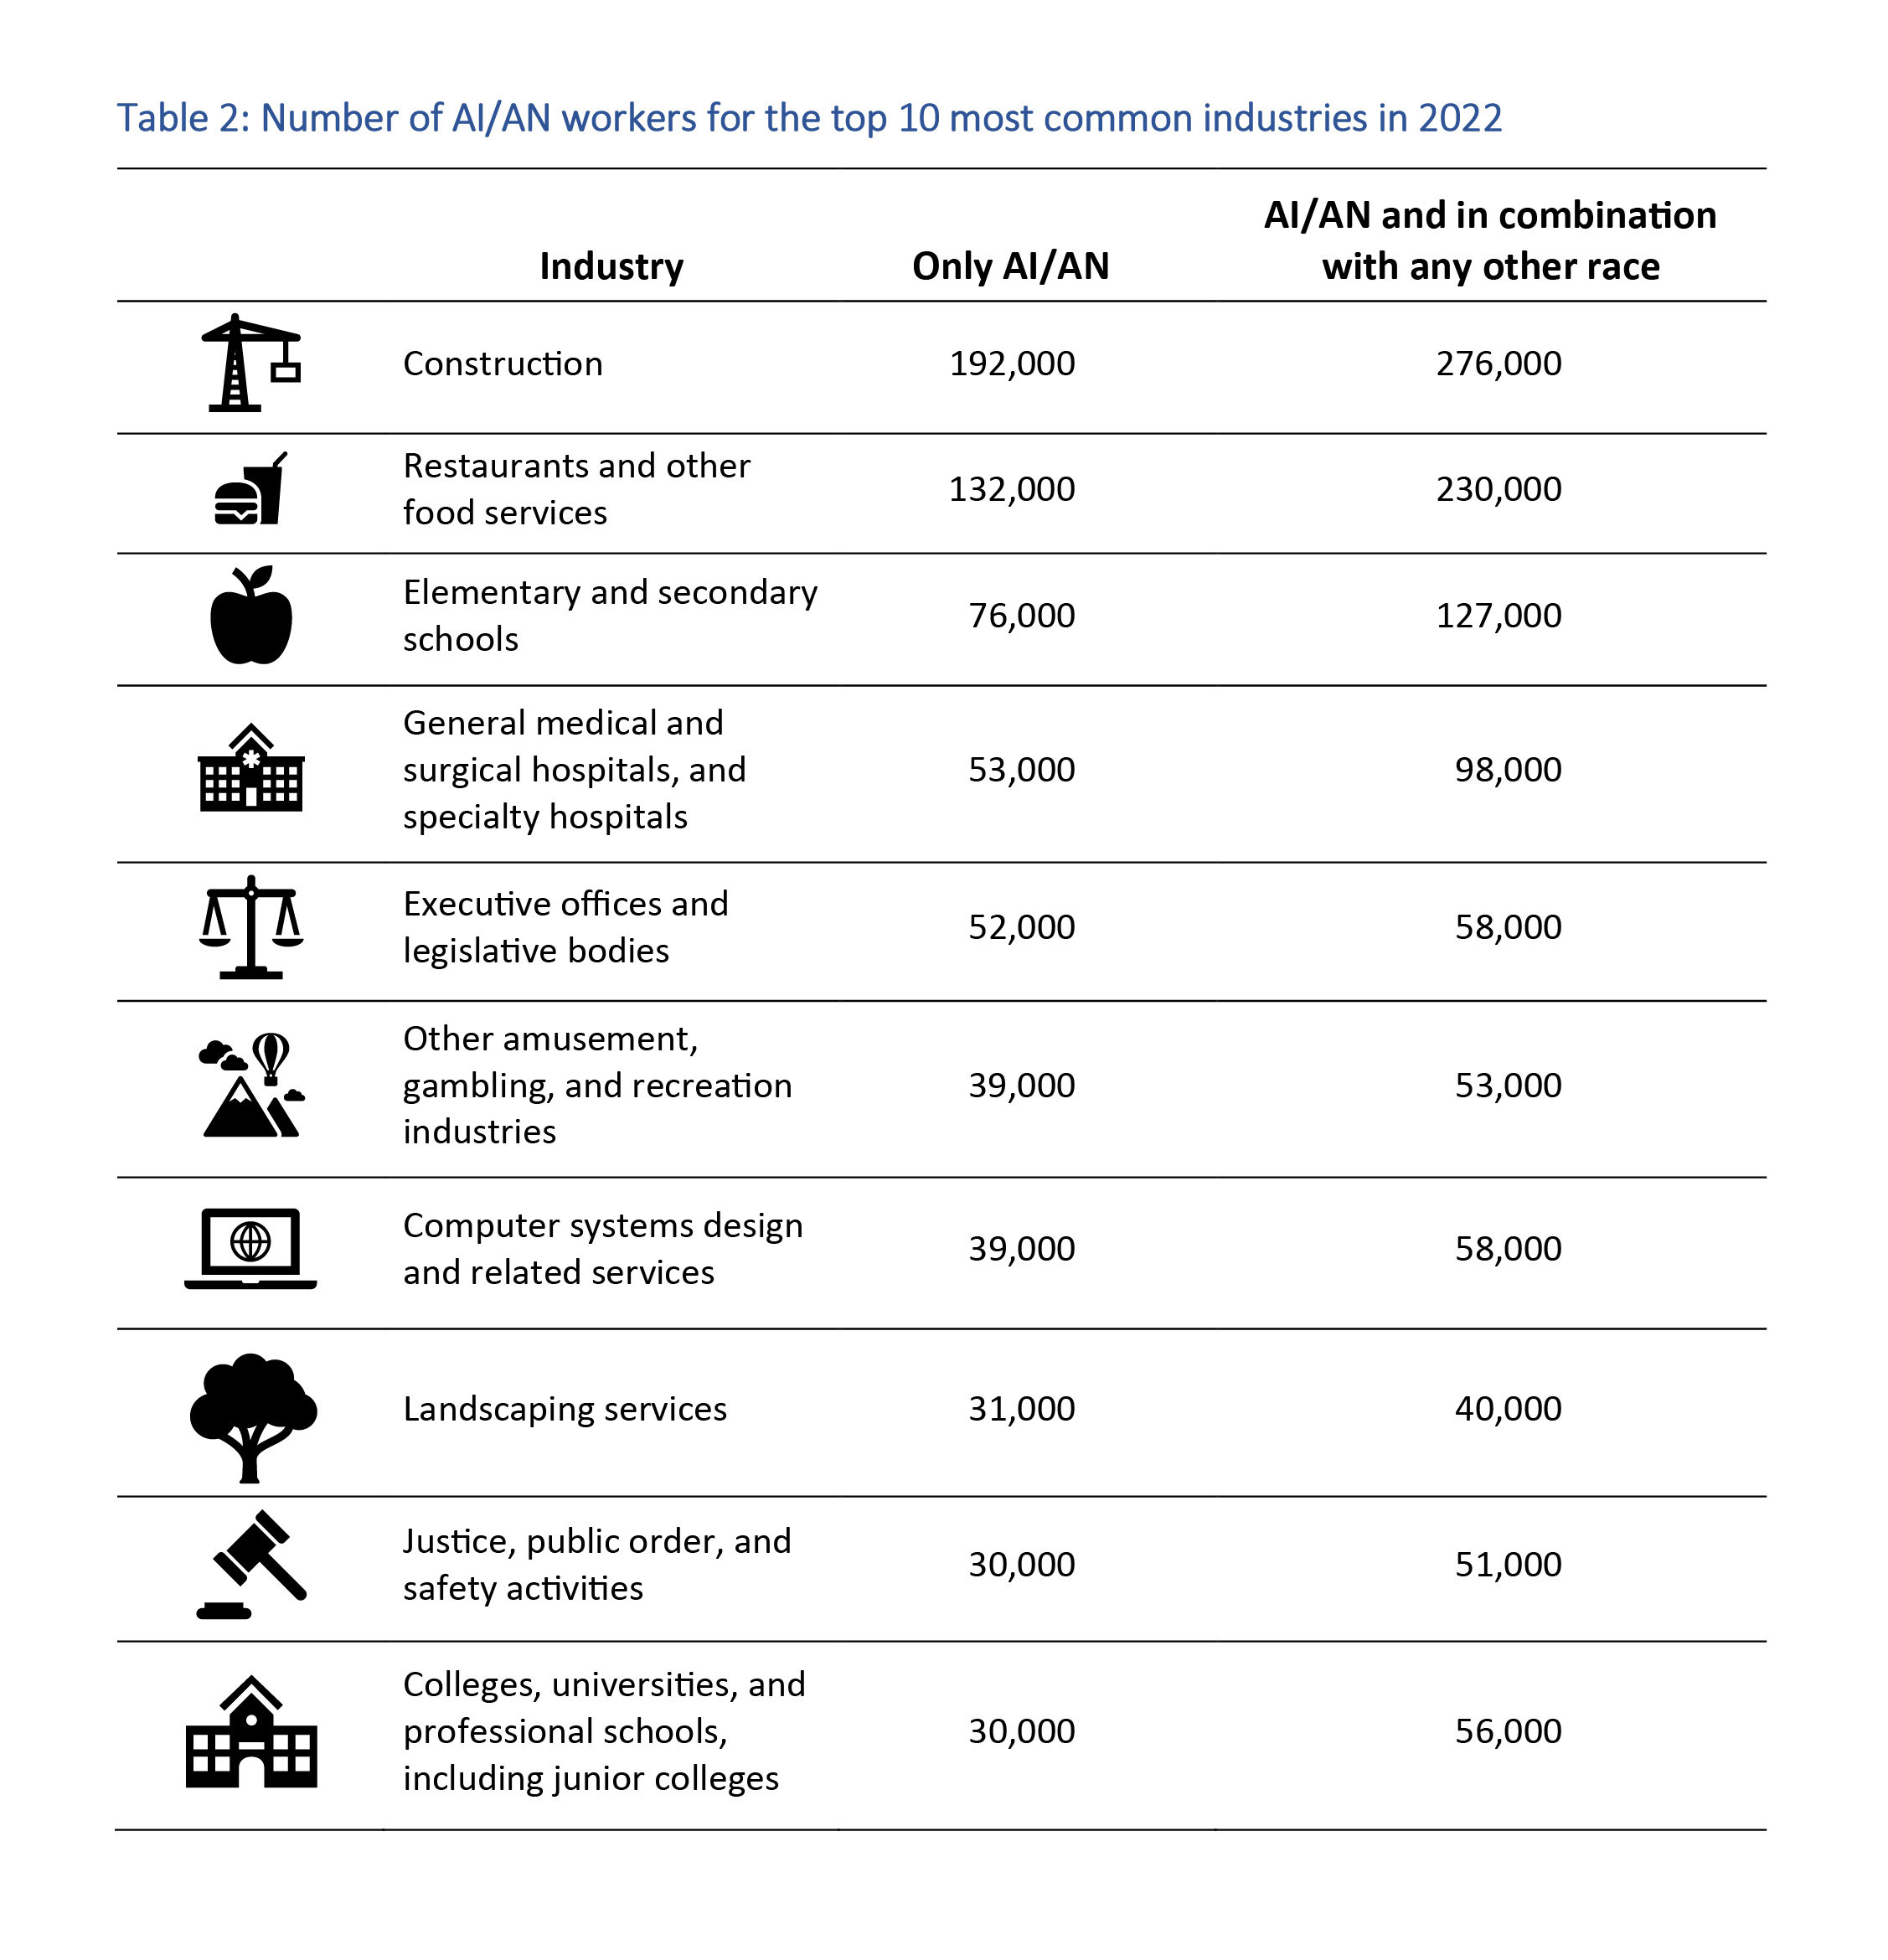
ELF was used to identify the most common occupations (see Table 1) and industries (see Table 2) among AI/AN workers in the United States.
How this information is useful
Public health professionals, medical personnel, and others can use this information to focus efforts meant to prevent work-related hazards, illnesses, and injuries. For example, since construction is a prominent industry among AI/AN communities, NIOSH and others could partner with public and private organizations to share information on construction safety, fatal falls, and occupational hearing loss.
More to Learn
AI/AN workers are essential to the U.S. economy. From these data, we can learn some details about the AI/AN workforce, but much more work is needed to understand these workers’ occupational safety and health needs better. Though surveys collect demographic information, the information on race and ethnicity may be limited.[3] In many cases, workforce data doesn’t offer the option to analyze data by tribal affiliation. Additionally, occupation and industry data only tell one piece of the story. Pairing employment data with illness or injury data provides the most accurate depiction of high-risk occupations and industries.
Better data on how occupations and industries differ by tribe, by urban vs. rural areas, and if workplace safety and health needs differ for those working on tribal lands versus off tribal lands is useful for everyone.
Stay tuned!
The final blog in this series will discuss the NIOSH Health Hazard Evaluation (HHE) program. And if you missed the first blog, read about it here! It provides an overview of the NIOSH AI/AN Initiative and AI/AN Worker Safety and Health Strategic Plan, along with a summary of how NIOSH is working to advance the plan.
We Want to Hear From You
NIOSH continues to do work in this area to understand the AI/AN workforce better. Please e-mail us at tribalworkers@cdc.gov with your input on the following.
How could NIOSH researchers, public health professionals, and AI/AN communities collaborate to enhance worker safety and health?
What other occupation and industry information would you like to learn more about? How would you like this information to be shared (e.g., summarized, in visuals or charts, electronically)?
Amy Mobley, MEn, is a Health Communications Specialist in NIOSH’s Health Informatics Branch in the Division of Field Studies and Engineering.
Jeffrey Shire, MS, is a Health Scientist in the NIOSH Division of Field Studies and Engineering.
Elizabeth Dalsey, MA, is a Health Communication Specialist in the NIOSH Western States Division.
Marie Haring Sweeney, PhD, MPH, is Chief of the Health Informatics Branch in the NIOSH Division of Field Studies and Engineering and coordinator for the NIOSH Surveillance Program.
[1] This is labeled in the CPS data as “AI/AN alone”
[2] Learn more about the framework Census uses for race: Improved Race, Ethnicity Measures Show U.S. is More Multiracial
[3] Measurement of Race and Ethnicity Across the Decades: 1790–2020
Posted on by

