Safety for Workers in Elementary and Secondary Schools
Posted on by As teachers, school administrators, students, and parents get ready to go back to school, safety should be top of mind. School safety most often emphasizes keeping students safe from violence, bullying and harassment, and the influence of substance use (NCSSLE, 2023), but it should also include the safety of those who work in schools. To highlight the injury risks experienced by workers in elementary and secondary schools, the National Institute for Occupational Safety and Health (NIOSH) examined data from the National Electronic Injury Surveillance System – occupational supplement (NEISS-Work).[1]
Data from NEISS-Work were used to identify nonfatal workplace injuries to workers in elementary and secondary schools (Bureau of Census industry code 7860; BOC, 2012a) who were treated in U.S. emergency departments (EDs). School workers include teachers, paraprofessionals, support staff and administrators, as well as custodial and food service staff. Data were analyzed to better understand the employees at risk and the types and causes of injuries to school workers. Injury variables were coded based on the Occupational Injury and Illness Classification System (BLS, 2012b). All rates were calculated using employment estimates derived from the Current Population Survey[2] (CPS) using the Employed Labor Force query system (NIOSH, 2023).
 Employees at Risk
Between 2015-2020, there were an estimated 46.7 million workers employed in primary and secondary schools in the U.S. During this six-year period the analysis revealed:
- There were an estimated 263,400 ED-treated injuries to elementary and secondary school workers, with an injury rate of 56 injuries per 10,000 elementary and secondary school full-time equivalents (FTEs), which is lower than the estimated ED-treated injury rate for all worker injuries in 2020 (130 per 10,000 FTE).
- Female employees in elementary and secondary schools incurred 69% (182,200 injuries) of ED-treated injuries over the six-year period. However, male workers had a higher rate of injury at 66 per 10,000 FTE compared to their female colleagues who had a rate of 53 per 10,000 FTE.
- Workers between the ages of 45 and 54 years experienced the most injuries (68,500 injuries), followed by workers 55-64 years (68,400 injuries). Employees younger than 25 years of age and those between the ages of 55 and 64 years had the highest rates of injury at 77 and 76 per 10,000, respectively.
Workplace Injuries
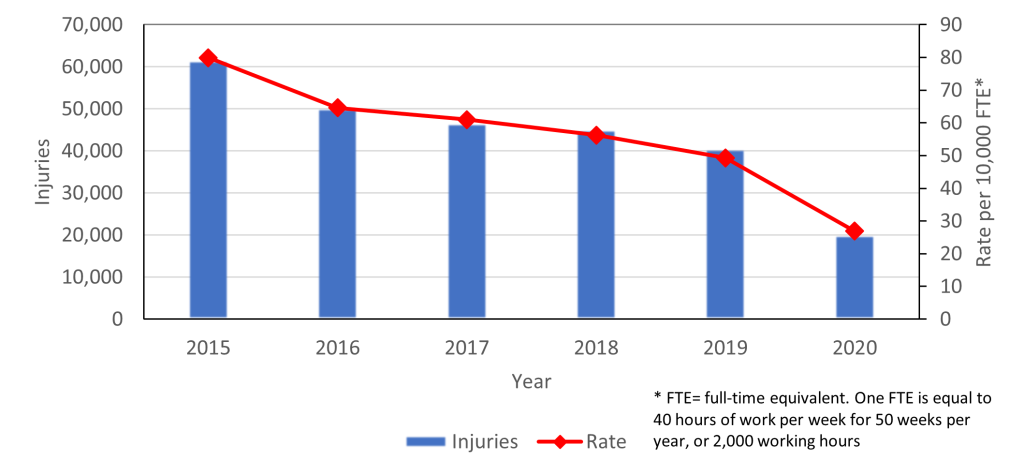
- Over the six-year period, the estimated number of ED-treated workplace injuries and rate of injuries to school employees declined at a consistent level (Figure 1). The low number of injuries found in 2020 was likely due to the COVID-19 pandemic and school closures during that time.
- School employees who sought ED treatment for their injuries most commonly experienced injuries to the head and face (69,000 injuries); followed by the arm, wrist and hand (59,800); and the leg, ankle, and foot (58,700).
 The most common injury event for workers in elementary and secondary schools resulted from falls, slips and trips (67,700 injuries), with over 78% of the fall-related injuries occurring on the same level (53,100 injuries).
- The second most frequent injury event was violence and other injuries by persons or animals, which accounted for 25% of all injuries (65,600 injuries). Intentional injuries by persons accounted for 57% or 37,400 of the violence-related injuries, followed by 25,600 injuries that were unintentional or the intent was unknown.
-
- Students were the primary source of injury in 83% or 31,200 of the intentional injury events.
- Of the ED-treated injuries resulting from intentional injuries by students, over 25% or 8,000 of the injuries occurred while workers were intervening in student fights or restraining a combative student.
- Students were the primary source of injury in 83% or 31,200 of the intentional injury events.
While ED surveillance data provide us with insight into a portion of the injuries experienced by school workers, it is important to remember there are injuries treated in other medical facilities, as well as incidents that do not result in injuries requiring medical treatment. Therefore, these estimates represent only part of the total incidents. This is especially notable when looking at violence where emotional harm may be the sole outcome from a violent encounter.
Although the estimated number of injuries decreased over our study period, workplace injuries to school employees remain a concern. The data from this analysis can be used to guide prevention efforts focusing on the most common causes and types of injures experienced by school employees. Falls and violence were the leading causes of injury for each of the six years examined. The risks for fall-related injuries can be reduced with known prevention efforts, such as non-slip flooring, adequate handrails, good housekeeping practices, and removal of tripping hazards from walkways. Violence-related injuries across all industries have proven to be more challenging. However, the education industry could benefit from adopting strategies similar to those already in use in other industries, such as healthcare, that have shown success in minimizing and preventing violence in the workplace.

NIOSH has previously and will continue to conduct research in this area and identify possible prevention strategies to address these unique situations. Links to previous NIOSH work in this area and safety recommendations are provided below.
Makayla Hughes worked as an intern from the Hispanic Association of Colleges and Universities (HACU) working for the NIOSH Division of Safety Research.
Kitty J. Hendricks, MA, is a Research Health Scientist for the NIOSH Division of Safety Research.
For more information
Workplace Violence Research | Blogs | CDC
Physical Assaults Among Education Workers – PMC (nih.gov)
Occupational Violence | NIOSH | CDC
Falls in the Workplace | NIOSH | CDC
References
Bureau of Labor Statistics (BLS). Census Industry Classification. US Department of Labor, 2012a. 2012 Census Industrial Classification (bls.gov). Accessed April 6, 2023.
Bureau of Labor Statistics (BLS). Occupational Injury and Illness Classification Manual version 2.01. US Department of Labor, Bureau of Labor Statistics. 2012b. OIICS Manual 2012 (bls.gov). Accessed March 7, 2023.
Centers for Disease Control and Prevention, Employed Labor Force (ELF) query system [CDC web site], 2023. NIOSH ELF (cdc.gov). Accessed April 6, 2023.
National Center on Safe Supportive Learning Environments (NCSSLE). Safety topics. 2023. Safety | National Center on Safe Supportive Learning Environments (NCSSLE) (ed.gov). Accessed April 6, 2023.
[1] NEISS-Work is a clustered sample of visits from a stratified probability-based sample of U.S. hospital emergency departments. Each NEISS-Work case is weighted based on the inverse probability of the reporting hospital being included in the sample. NEISS-Work work-related injury estimates were derived by summing the weights for the cases of interest.
[2] CPS is a monthly national survey that includes employment information for persons as young as 15 years old.
Posted on by

