Workplace Lead Exposure Trends
Posted on by
What do home renovations, bullet manufacturing, and battery recycling have in common? You could be exposed to lead while working with materials used during these activities.
Though lead is hazardous to our health, it is still used worldwide. Each October, we recognize the importance of preventing lead exposure during National Lead Poisoning Prevention Week. This year, we’d like to share some of the most recent information we have related to lead exposure and America’s workplaces.
Visualizing the Trend
We developed a series of data visualizations for you to quickly look at the data and see how work-related lead exposures have changed. Rather than posting a spreadsheet or static charts, these data visualization provide an interactive experience and detail for those interested in work-related lead exposure surveillance.
Our three dashboards present:
1. Lead Exposure Trends Over Time
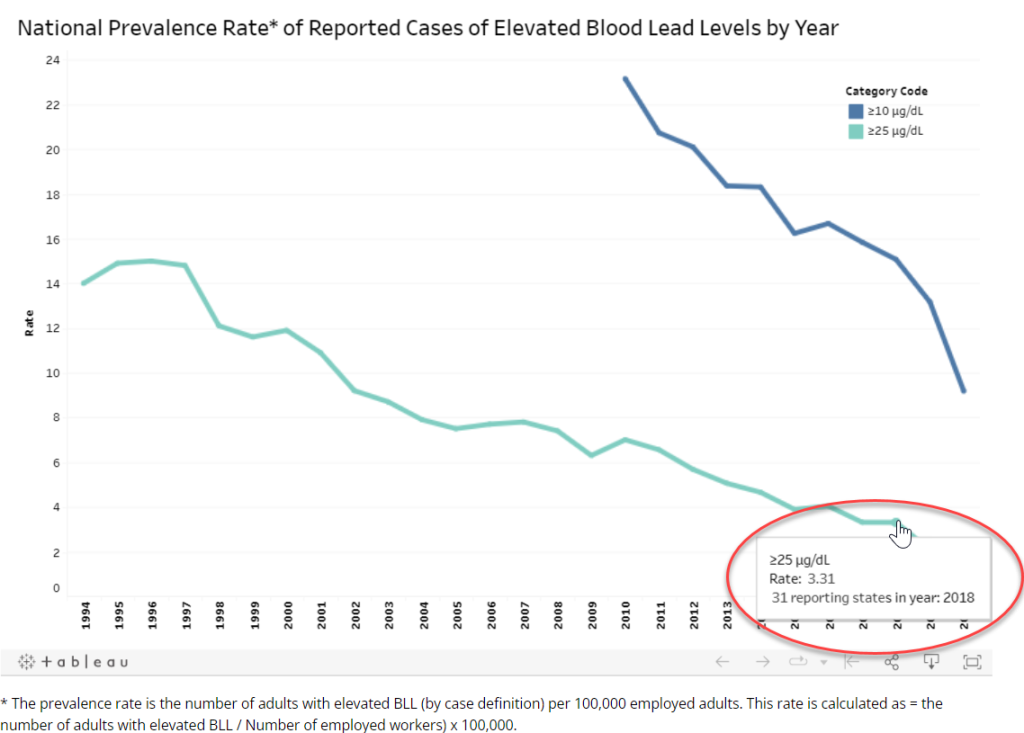
Since 1994, NIOSH’s Adult Blood Lead and Epidemiology Surveillance program has provided data on work-related lead exposure. In 1994, 14 per 100,000 working adults had elevated blood lead levels (BLLs) of 25 µg/dL. Due to efforts to keep workers safe from lead, the rate has dropped slowly over time. In 2018**, the rate was down to 3 adults per 100,000.
In 2011, the case definition for elevated BLL was reduced from 25 µg/dL to 10 µg/dL. Therefore, data for 10 µg/dL was not collected until 2011. Since then, the rate for cases of 10 µg/dL dropped from 20 adults per 100,000 to 15 per 100,000 working adults in 2018.
Visit the website to try out the dashboard and see how lead exposure has changed over time.
** though we have data for 2019 and 2020, we are presenting the 2018 data because it is more robust. States are still sending in data for 2019 and 2020.
2. Lead Exposure Trends by State
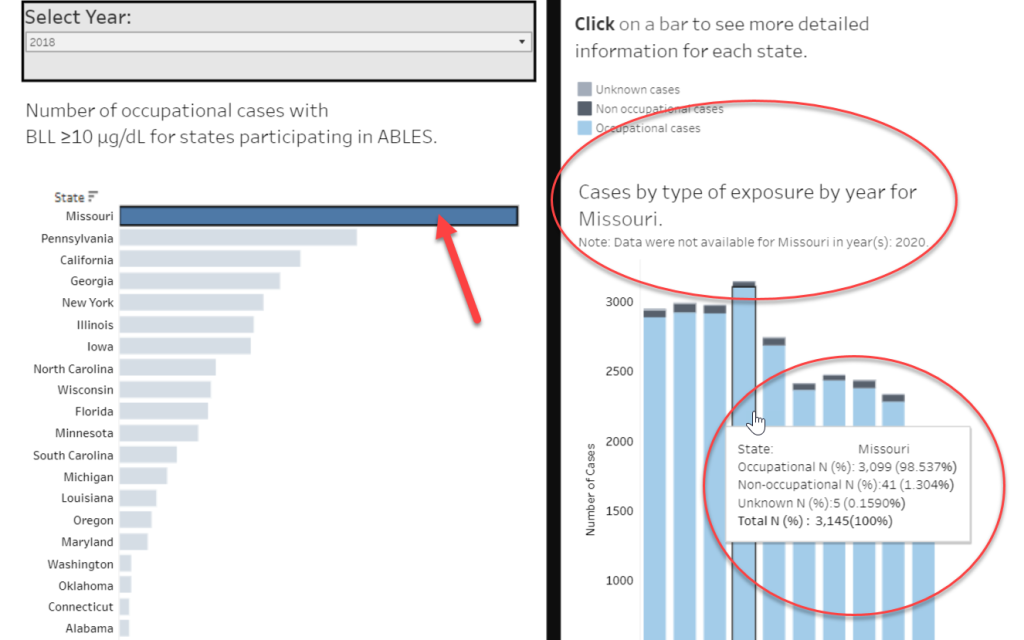
In 2018, Missouri had the highest number of work-related lead exposure cases. As you click through the years, you may note that Missouri and Pennsylvania have consistently ranked among the states with the highest lead exposure. When you click on the bar for Missouri, you can see that over 90% of Missouri’s lead poisonings are work-related.
Visit the website to try out the dashboard and learn more about lead exposure by state.
3. Lead Exposure Trends by Industry
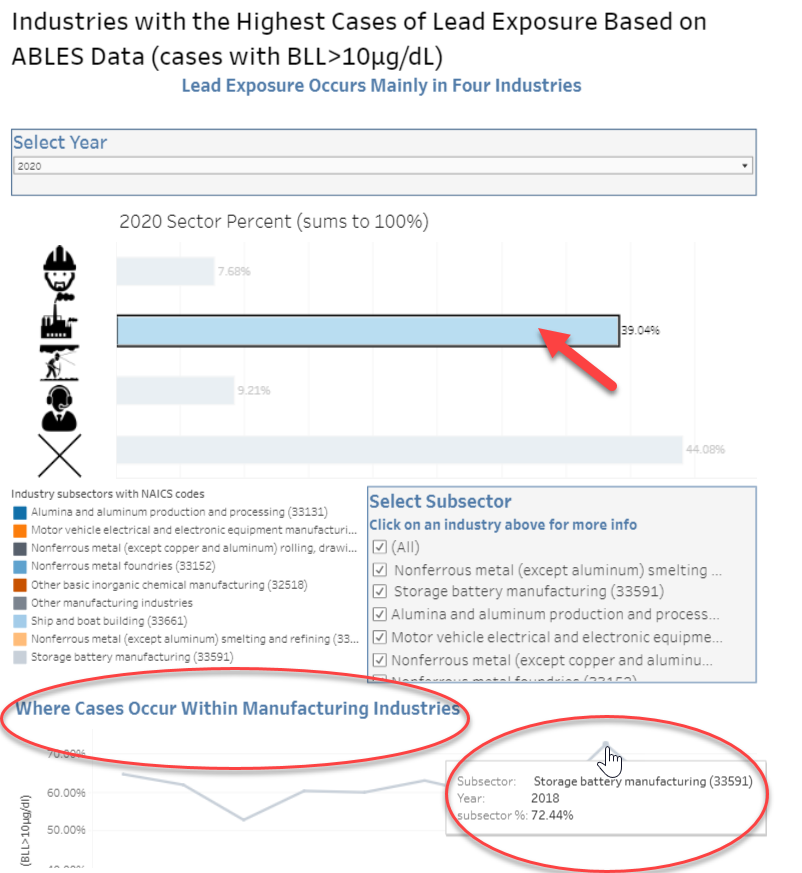
Lead exposure is most likely in four main industries: Construction, Manufacturing, Mining, and Services. All other industries are grouped into the Other/Missing Industry category. Manufacturing has consistently ranked highest for lead exposure since we began collecting 10 µg/dL case data. In 2018, well over half of workers exposed to lead were from the manufacturing industry. If we click on the bar for manufacturing, we can see that most of those cases occurred in the storage battery manufacturing subsector. Visit the website to try out the dashboard and learn more about lead cases across these industries.
What else would you like to see?
Data visualization is one way we can communicate and share our research and data with the public.
We are always looking for new ideas and ways to improve. What other information would you like us to show? Do you have ideas for making these visuals better? Please share your comments below.
Rebecca Tsai, PhD, is an Epidemiologist in NIOSH’s Health Informatics Branch in the Division of Field Studies and Engineering.
Amy Mobley, MEn, is a Health Communications Specialist in NIOSH’s Health Informatics Branch in the Division of Field Studies and Engineering.
Posted on by