Measuring Workplace Risks across States
Posted on byWhen assessing workplace safety in the United States, we have to consider what measures of risk to use. If all measures are strongly positively correlated, this may not matter. But they are not, so the choice of risk measure does matter: states where employers report the highest rates of non-fatal injuries have the lowest fatality rates; and those with the lowest non-fatal rates have high fatality rates.
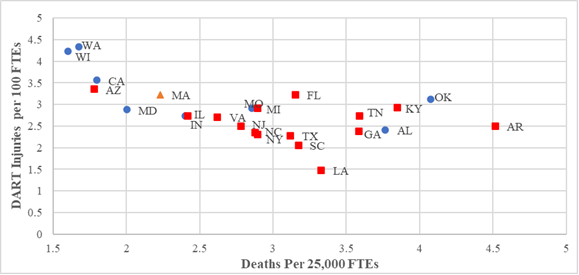
The figure below compares the fatality and DART (Days Away from work, Restricted work activity or Transfer to another job) [1] rates for 24 states for 1996-2014. The correlation was negative 0.37. For example, Georgia had half the DART rate reported by Wisconsin construction employers, but its fatality rate was 2.5 times higher than Wisconsin’s. Similarly, Texas had a DART rate half that of California’s, but its fatality rate was over 30% higher. For smaller spans of time, the negative correlation was higher (-.45 for the first half of the 1996-2014 period and -.44 for the second half).
To make sense of these findings, it is important to remember that most observers think that the Census of Fatal Occupational Injuries (CFOI) provides a good count of traumatic occupational deaths, while there are many concerns about underreporting in the Survey of Occupational Injuries and Illnesses (SOII). However, few studies have focused on variations in SOII underreporting across states.[1] The findings discussed here are for the construction industry, chosen in part because it has both large numbers of deaths and high death rates.
Consider one way that this finding matters. In 1999 in response to proposed legislation to require firms to establish safety and health programs, opponents noted that states that already had such mandates—California, Washington and Oregon—all had lost-workday rates that were higher than the national average.[2] Critics ignored that these states all had fatality rates that were well below the national average. This lack of understanding undermines research on safety as well as public policy. Researchers continue to use the non-fatal injury rates to try to learn why certain states are safer, not realizing that the measure they are using may have it exactly backwards.
Why do we find a negative correlation? We review some other explanations below, but we think that employers in some states are more likely to suppress injury reporting and that those employers are often less committed to safety. Features of the workers’ compensation (WC) system could affect injury reporting and safety incentives. For example, states where workers have to wait 7 days before claiming WC benefits have reported non-fatal rates in the BLS survey that are 30%-40% lower than rates in states with 3-day waiting periods.[3] (The figure also shows the WC waiting period for the states.) Workers are likely to be reluctant to report an injury or to take time off if they have to wait 7 days before receiving their benefits. Getting fewer WC claims reduces the costs of accidents to employers and, although temporary indemnity benefits are a small slice of those costs, the medical payments avoided are larger. Perhaps more importantly, having fewer injury claims substantially reduces the information that employers, workers and regulatory agencies get about the risks at the workplace and the salience of that information.
The following observations offer possible alternative explanations for why we might find a negative correlation.
Observation: Some observe that the causes of fatalities and non-fatal injuries are quite different and, as a result, we should not necessarily expect a strong positive correlation between them.
Response: As noted, we deleted deaths due to most transportation events and to violence, which are two main causes of fatalities that play much smaller roles in non-fatal injuries. More importantly, if the two rates were really independent, we should find a correlation close to zero, not one that is significantly negative.
Observation: The composition of the construction industry does vary across states and some types (e.g., heavy construction) have higher fatality rates.
Response: States do differ in their industry composition, but we also carried out the same analysis for the largest construction sub-industry—specialty trades contractors—and found a correlation that was negative and higher than that for the whole construction industry.
States where employers underreport non-fatal injuries are more likely to have high fatality rates. We think that better reporting is related to factors that lead to greater prevention efforts, which show up in lower fatality rates. Please share your thoughts on additional/alternative suggestions in the comment section below.
John Mendeloff, PhD, is Professor of Public Affairs at the University of Pittsburgh and former director of the RAND Corporation Center for Health and Safety in the Workplace
Wayne B. Gray, PhD is John T. Croteau Professor of Economics at Clark University and Research Associate at the National Bureau of Economic Research.
The views expressed by guest authors do not necessarily reflect the views of CDC or NIOSH.
References
[1] Non-fatal rates are based on employer reports collected by the Bureau of Labor Statistics (BLS) Survey of Occupational Injuries and Illnesses (SOII). Fatality rates are based on the BLS Census of Fatal Occupational Injuries (CFOI). Our fatality rates omit deaths due to highway motor vehicle crashes, public transportation (e.g., airplane crashes) and violence, which account for about 25-30% of construction deaths, but only about 5% of DART cases. We omitted them because we wanted to concentrate on fatalities more directly related to construction workplace hazards.
[2] Mendeloff J, Burns, R. (2013) States with Low Non-Fatal Injury Rates Have High Fatality Rates and Vice-Versa. Am J. Ind. Med. 56:509-519.
[3] Jeffress CN. 1999. ‘‘Statement of Charles N. Jeffress, Assistant Secretary for Occupational Safety and Health, U.S. Department of Labor before the Subcommittee on Employment, Safety and Training, Health, Education, Labor and Pensions Committee, United States Senate.’’
[4] Butler RJ, Worrall JD. 1983. Workers’ compensation: Benefits and injury claims rates in the seventies. Rev Econ Stat 65(4):580–589.
Posted on by