CDC’s Tracking Network in Action
Posted on by
CDC’s Environmental Public Health Tracking Network empowers people to use data and tools to take public health action and improve community health.
CDC’s Environmental Public Health Tracking Network (Tracking Network) has been connecting people with vital public health information since 2009. CDC has made continual improvements to the Tracking Network’s data by developing tools to make it easier to understand and use data. The Tracking Network has also expanded the amount of timely data that can be used for responding to urgent health issues, such as emergency response work and environmental justice.
Data Tools for Public Health Action
- Data Dashboards: CDC’s Tracking Network has developed several interactive, topic-based data dashboards, which are designed to be a user-friendly approach to environmental health data. For example, CDC’s Environmental Justice (EJ) Dashboard is designed to make environmental justice data easier to understand, and more accessible to those with different levels of health and data literacy. When you enter your zip code into the EJ Dashboard, you can explore interactive infographics and maps to better understand environmental justice issues in your neighborhood. Explore more of Tracking’s Data Dashboards.
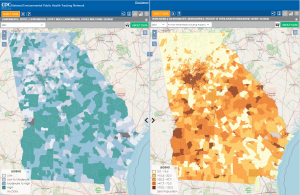 Data Explorer: CDC’s Data Explorer is a dynamic web-based tool where you can visualize over 600 data measures on a variety of environmental and health topics. You can visualize data in maps, charts, and tables as well as view different data sets side-by-side. The Data Explorer is always being upgraded with new tools and features. For example, the new Environmental Justice Index (EJI) is available on the Data Explorer so you can visualize these data alongside other environmental health topics. The image to the right shows the EJI being visualized alongside demographic information (percent of population that identify as non-white, including Hispanic).
- Data Science Tools: The Tracking Network provides many tools and resources for you to use the data available for your own websites or analysis. For example, you can use Tracking’s API (Application Program Interface) to import data into different applications for your own analysis and app building.
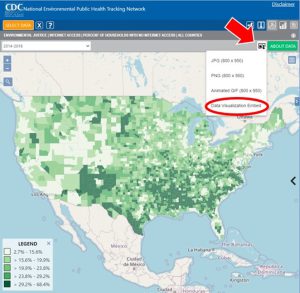 Data Visualization Embedding (DVE): Simply navigate to the Tracking Network’s Data Explorer, select the data you want, and click the “Go” button. When the visualization loads, click on the black and white export/embed icon and select “Data Visualization Embed.” The DVE feature produces a small snippet of code that you can copy and paste into the code for any website. The embedded visualizations maintain the same look and functionality of the Data Explorer, including zoom, hover text, and customizations (e.g., map layers, table sorting, charting options). DVE is available for all maps, tables, and charts generated by the Tracking Network.
- CDC’s Tracking Network also has resources for researchers and developers, including data methodologies and tools for analysis available on our GitHub. The Tracking Network also provides training webinars to learn how to use the Tracking Network’s data and API in other programming languages, such as in Tracking’s Developer Series.
Data Modernization
CDC’s Environmental Public Health Tracking Program and the Water, Food, and Environmental Health Services Branch are working together to enhance and expand environmental health data modernization efforts across the country. Learn more about the Data Modernization efforts of CDC’s Tracking Network.
State and Local Health: Tracking in Action
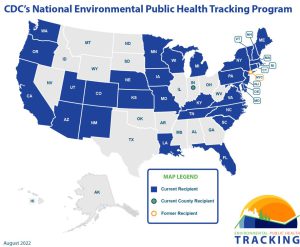
CDC funds 33 state and local tracking programs to build, maintain, and implement local tracking programs and data networks, to grow public health capacity and expertise in environmental health surveillance, and to modernize data systems. See how environmental public health tracking programs across the country are making a difference in the lives of individuals.
- Success Stories: The Tracking Network’s data and activities have informed over 500 public health actions in communities across the country.
- Tracking in Action: Watch videos showing how tracking programs are improving public health for their communities.
- Faces of Tracking: Read stories from real people who have benefited from tracking or have used tracking data to propel public health change across the United States.
Because of the Tracking Program, communities can make informed decisions about allocating resources, planning interventions, and evaluating efforts to improve public health.
Keep Track of Us!
Follow us on Twitter (@CDC_EPHTracking) and Facebook (@CDCEPHTracking) to stay up to date on Data Explorer features, new tools, national health trends, and more.
More Information
Post a Comment