Binge Drinking Intensity and Health-Related Quality of Life Among US Adult Binge Drinkers
Posted on byPEER REVIEWED
Xiao-Jun Wen, MD; Dafna Kanny, PhD; William W. Thompson, PhD; Catherine A. Okoro, MS; Machell Town, MS; Lina S. Balluz, ScD, MPH
Suggested citation for this article: Wen XJ, Kanny D, Thompson WW, Okoro CA, Town M, Balluz LS. Binge drinking intensity and health-related quality of life among US adult binge drinkers. Prev Chronic Dis 2012;9:110204. DOI: http://dx.doi.org/10.5888/pcd9.110204.
Abstract
Introduction
Binge drinking (men, ≥5 drinks, women, ≥4 on an occasion) accounts for more than half of the 79,000 annual deaths due to excessive alcohol use in the United States. The frequency of binge drinking is associated with poor health-related quality of life (HRQOL), but the association between binge drinking intensity and HRQOL is unknown. Our objective was to examine this association.
Methods
We used 2008-2010 Behavioral Risk Factor Surveillance System data and multivariate linear regression models to examine the association between binge drinking intensity (largest number of drinks consumed on any occasion) among US adult binge drinkers and 2 HRQOL indicators: number of physically and mentally unhealthy days.
Results
Among binge drinkers, the highest-intensity binge drinkers (women consuming ≥7 drinks and men consuming ≥8 drinks on any occasion) were more likely to report poor HRQOL than binge drinkers who reported lower levels of intensity (women who consumed 4 drinks and men who consumed 5 drinks on any occasion). On average, female binge drinkers reported more physically and mentally unhealthy days (2.8 d and 5.1 d, respectively) than male binge drinkers (2.5 d and 3.6 d, respectively). After adjustment for confounding factors, women who consumed ≥7 drinks on any occasion reported more mentally unhealthy days (6.3 d) than women who consumed 4 drinks (4.6 d). Compared with male binge drinkers across the age groups, female binge drinkers had a significantly higher mean number of mentally unhealthy days.
Conclusion
Our findings underscore the importance of implementing effective population-level strategies to prevent binge drinking and improve HRQOL.
Top of Page
Introduction
Excessive alcohol consumption, including binge and underage drinking, is the third leading preventable cause of death in the United States, and binge drinking, defined for women as consuming 4 or more alcoholic drinks on an occasion and for men as consuming 5 or more drinks on an occasion, accounts for more than half of the 79,000 annual deaths due to excessive drinking (1,2). Binge drinking is a common form of excessive alcohol use in the United States (1). According to 2009 Behavioral Risk Factor Surveillance System (BRFSS) data, an estimated 15.2% of adults (20.7% of men and 10.0% of women) are binge drinkers (2). Among some population groups, such as people aged 18 to 34 years, the prevalence of binge drinking is even higher (2,3). The frequency (4) (ie, number of binge drinking episodes within a defined time period) and intensity (4) (ie, number of drinks consumed per episode) of binge drinking are 2 measures used to examine the adverse health effects for this risk behavior (5). Several studies have demonstrated that risk of alcohol-related illness and death increases with the intensity of binge drinking (6-8).
Several studies have examined the association between health-related quality of life (HRQOL) and alcohol use (9,10) and the association between binge drinking and certain risk behaviors (eg, alcohol-impaired driving and violence) (11,12). In 2004, 1 study (13) reported that frequent binge drinking was associated with significantly worse HRQOL and mental distress, including stress, depression, and emotional problems. However, the relationship between the intensity of binge drinking per episode and HRQOL has not been examined. The primary objective of this study was to examine the association between HRQOL and the intensity of binge drinking among US adult binge drinkers. A secondary objective was to compare sex differences in HRQOL by sociodemographic characteristics and the intensity of binge drinking.
Methods
We used 2008-2010 BRFSS data and multivariate linear regression models to assess the relationship between binge drinking intensity and HRQOL.
Data source
The BRFSS survey is a state-based, continuous random-digit–dialed telephone survey that collects information on risk behaviors and health conditions from noninstitutionalized adults aged 18 or older in 50 states; Washington, DC; and US territories. Trained interviewers collect data monthly by using an independent probability sample of households with landline telephones. The characteristics, survey design, and random sampling of BRFSS are described elsewhere (14). The validity and reliability of BRFSS data have been demonstrated (15,16).
Assessment of binge drinking
We defined binge drinking by using the question, “Considering all types of alcoholic beverages, how many times during the past 30 days did you have [5 for men, 4 for women] or more drinks on an occasion?” We assessed the intensity of binge drinking among binge drinkers by using the question, “During the past 30 days, what is the largest number of drinks you had on any occasion?” We calculated the median largest number of drinks consumed and then categorized female binge drinkers into 4 groups (4, 5, 6, and 7 or more drinks on any occasion during the past 30 days); and male binge drinkers into 4 groups (5, 6, 7, and 8 or more drinks on any occasion during the past 30 days).
Assessment and definition of HRQOL
We analyzed 2 of the HRQOL questions that are administered annually in the core BRFSS survey: 1) “Now thinking about your physical health, which includes physical illness and injury, for how many days during the past 30 days was your physical health not good?” and 2) “Now thinking about your mental health, which includes stress, depression, and problems with emotions, for how many days during the past 30 days was your mental health not good?” The reliability and validity of these measures have been described (17). We calculated physically and mentally unhealthy days according to the methodology and computer program code published by the Centers for Disease Control and Prevention (18).
Participants
We examined 2008-2010 BRFSS data from respondents who resided in any of the 50 states and Washington, DC, and reported at least 1 binge drinking episode in the past 30 days. Of the 133,353 binge drinkers, 76,269 (66.6%) were men. The median response rates (calculated according to Council of American Survey Research Organizations methods) were 53.3% (range, 35.8%-65.9%) for 2008, 52.5% (range, 37.9%-68.9%) for 2009, and 54.6% (range, 39.1%-68.8%) for 2010. The cooperation rates were 75.0% (range, 59.3%-87.8%) for 2008, 75.0% (range, 55.0%-88.0%) for 2009, and 76.9% (range, 56.8%-86.1%) for 2010.
Sociodemographic characteristics
We analyzed binge drinking intensity and HRQOL by the following sociodemographic variables: age group (18-44 y and ≥45 y); race/ethnicity (non-Hispanic white, non-Hispanic black, Hispanic, and non-Hispanic other); marital status (married, previously married, and never married); education (<high school diploma, high school diploma, some college or technical school, and ≥college degree); employment (employed, unemployed, homemaker/student, retired, and unable to work); and income (<$25,000, $25,000 to <$50,000, and ≥$50,000).
Data analysis
We calculated the mean number of physically and mentally unhealthy days by sociodemographic characteristic and by binge drinking intensity. We conducted multivariate linear regression analyses for the predicted mean number of unhealthy days by sex and largest number of drinks consumed while adjusting for age, race/ethnicity, education, marital status, income, and employment. Because of the complex sampling design of BRFSS, we used SUDAAN version 9.2 (Research Triangle Institute, Research Triangle Park, North Carolina) to calculate weighted prevalence estimates and 95% confidence intervals (CIs). We used nonoverlapping 95% CIs as the criteria for statistical significance.
Results
The median largest number of drinks consumed was 5 (range, 4-14 drinks) for female binge drinkers and 6 (range, 5-29 drinks) for male binge drinkers. Among women, the median intensity of binge drinking was similar among sociodemographic groups. However, among men, the median intensity of binge drinking was higher among men aged 18 to 44 (7 drinks) than among men aged 45 or older (6 drinks), among men who never married (8 drinks) than among men who were married (6 drinks), and among men who were homemaker/students (8 drinks) than among men who were retired or employed (6 drinks).
Overall, female binge drinkers reported more unhealthy days (2.8 physically unhealthy days and 5.1 mentally unhealthy days) than male binge drinkers (2.5 physically unhealthy days and 3.6 mentally unhealthy days) (Table 1). The mean number of mentally unhealthy days among women and men aged 18 to 44 was significantly higher than the mean number for those aged 45 or older, whereas the mean number of physically unhealthy days among men and women aged 45 or older was significantly higher than the mean number for the younger age group. Men and women who were previously married had a significantly higher mean number of physically and mentally unhealthy days than men and women who were married or never married.
Female binge drinkers who consumed 7 or more drinks on any occasion reported significantly more unhealthy days (3.2 physical and 6.9 mental) compared with those who were binge drinking at a lower intensity (Table 1). Similarly, male binge drinkers who consumed 8 or more drinks on any occasion reported significantly more mentally unhealthy days (4.3 d) compared with those who were binge drinking at a lower intensity.
After adjustment for potential confounding factors (age, race/ethnicity, education, marital status, income, and employment), female binge drinkers who consumed 7 or more drinks had more mentally unhealthy days compared with female binge drinkers who consumed 4 drinks, and male binge drinkers who consumed 8 or more drinks had more mentally unhealthy days compared with male binge drinkers who consumed 5 drinks (Table 2).
In general, among all age groups for both sexes, the mean number of physically unhealthy days was associated with binge drinking intensity (Figure 1). The mean number of physically unhealthy days among both sexes aged 45 older was higher than for those aged 18 to 44. In general, among all age groups for both sexes, the mean number of mentally unhealthy days was associated with binge drinking intensity (Figure 2). The mean number of mentally unhealthy days among female binge drinkers was significantly higher than the mean number for male binge drinkers. We found no significant interactions between age and intensity of binge drinking in any of the linear regression models.
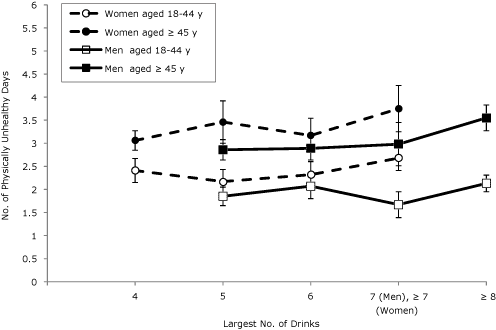
Figure 1. Predicted mean number of physically unhealthy days by sex and age among binge drinkers, adjusted for race/ethnicity, education, marital status, income, employment, and survey year. Binge drinking is defined as 4 or more drinks for women and 5 drinks or more drinks for men on an occasion. Error bars indicate 95% confidence
intervals. Data are from 50 states and Washington, DC; Behavioral Risk Factor Surveillance System, 2008-2010.
[A tabular version of this figure is also available.]
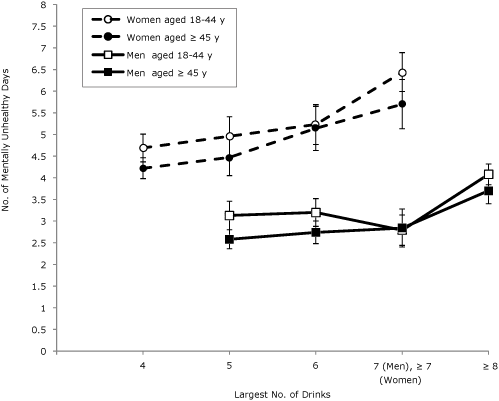
Figure 2. Predicted mean number of mentally unhealthy days by sex and age among binge drinkers, adjusted for race/ethnicity, education, marital status, income, employment, and survey year. Binge drinking is defined as 4 or more drinks for women and 5 drinks or more drinks for men on an occasion. Error bars indicate 95% confidence intervals. Data are from 50 states and Washington, DC; Behavioral Risk Factor Surveillance System, 2008-2010. [A tabular version of this figure is also available.]
Discussion
Although several studies have examined either sex-specific or alcohol-specific effects for HRQOL (13,19-21), this is the first study to examine the association between binge drinking intensity and HRQOL by sex. Adults who had high-intensity levels of binge drinking were more likely to report poor HRQOL than adults who had lower-intensity levels of binge drinking. This pattern was found for 2 measures of HRQOL — physically and mentally unhealthy days.
Among female binge drinkers, the highest-intensity binge drinkers had 37% more mentally unhealthy days than the lowest-intensity binge drinkers. This estimate of 1 or 2 additional unhealthy days per month is considered a
meaningful difference in HRQOL (22).
We also found age effects for physically unhealthy days for both sexes; those aged 45 or older had significantly more physically unhealthy days than those aged 18 to 44. Age effects are likely due in part to the development of chronic conditions that increasingly affect health and well-being across the life span (23,24). The frequency and intensity of alcohol consumption are both important indicators for measuring and assessing the effect of binge drinking (5). A previous study found that poor HRQOL was associated with frequent binge drinking (13). Our study demonstrated that poor HRQOL (physically and mentally unhealthy days) was associated with the intensity of binge drinking among adults who reported binge drinking.
This study has several limitations. First, BRFSS is a landline telephone survey; therefore, people with cellular telephones only or no landline telephones are excluded, which may result in sampling bias. Studies show that an increasing proportion of young adults aged 18 to 34 use cellular telephones exclusively (25) and that the prevalence of binge drinking is approximately one-third higher among cellular telephone users than landline respondents to the BRFSS (2). Second, BRFSS data are self-reported and may be subject to recall and social desirability biases (26). A recent study based on state alcohol sales found that BRFSS identifies only 22% to 32% of presumed alcohol consumption (27). Third, this study is cross-sectional; therefore, any cause and effect between poor HRQOL and level of binge drinking intensity cannot be inferred. Fourth, a previous study (13) demonstrated that the frequency of binge drinking was associated with HRQOL, whereas our study investigated the relationship between the intensity of binge drinking and HRQOL. Further studies are needed to explore the effects of both frequency and intensity of binge drinking on HRQOL to better understand sex-specific effects.
This study also has several strengths. First, to our knowledge, it is the first study to assess the relationship between intensity of binge drinking and physical and mental health components of HRQOL. Second, the large sample of binge drinkers and the BRFSS sampling design suggest that these associations would be similar to those for all noninstitutionalized adult binge drinkers in the United States.
The results of this study support the recommendations of the US Preventive Services Task Force (28) to implement screening and counseling for alcohol misuse, including binge drinking, among adults by physicians and other health care providers. Such screening and counseling can highlight the negative consequences of binge drinking on current physical and mental health. In addition, these results support the use of binge drinking intensity as a measure that could be monitored when implementing and evaluating evidence-based population-level intervention strategies, such as increasing alcohol excise taxes (29) and limiting the density of alcohol sales outlets (30) to reduce drinking intensity and improve HRQOL.
Acknowledgments
We thank the BRFSS coordinators from 50 states and Washington, DC, and members of the Survey Operation Team in the Division of Behavioral Surveillance, Public Health Surveillance Program Office, Office of Surveillance, Epidemiology, and Laboratory Services, Centers for Disease Control and Prevention, for their help in collecting the data used in this study.
Author Information
Corresponding Author: Dafna Kanny, PhD, Division of Adult and Community Health, National Center for Chronic Disease Prevention and Health Promotion, Centers for Disease Control and Prevention, 4770 Buford Hwy NE, MS K-67, Atlanta, GA 30341. Telephone: 770-488-5411. E-mail: dkk3@cdc.gov.
Author Affiliations: Xiao-Jun Wen, William W. Thompson, Catherine A. Okoro, Machell Town, Lina S. Balluz, Centers for Disease Control and Prevention, Atlanta, Georgia.
References
- Naimi TS, Brewer RD, Mokdad A, Denny C, Serdula MK, Marks JS. Binge drinking among US adults. JAMA 2003;289(1):70-5.
- Centers for Disease Control and Prevention. Vital signs: binge drinking among high school students and adults — United States, 2009. MMWR Morb Mortal Wkly Rep 2010;59(39):1274-9.
- Miller JW, Gfroerer JC, Brewer RD, Naimi TS, Mokdad A, Giles WH. Prevalence of adult binge drinking: a comparison of two national surveys. Am J Prev Med 2004;27(3):197-204.
- Naimi TS, Nelson DE, Brewer RD. The intensity of binge alcohol consumption among U.S. adults. Am J Prev Med 2010;38(2):201-7.
- World Health Organization. International guide for monitoring alcohol consumption and related harm. Geneva (CH): World Health Organization; 2000.
- Vinson DC, Maclure M, Reidinger C, Smith GS. A population-based case-crossover and case-control study of alcohol and the risk of injury. J Stud Alcohol 2003;64(3):358-66.
- Wechsler H, Nelson TF. Relationship between level of consumption and harms in assessing drink cut-points for alcohol research: commentary on “Many college freshmen drink at levels far beyond the binge threshold” by White et al. Alcohol Clin Exp Res 2006;30(6):922-7.
- Zador PL, Krawchuk SA, Voas RB. Alcohol-related relative risk of driver fatalities and driver involvement in fatal crashes in relation to driver age and gender: an update using 1996 data. J Stud Alcohol 2000;61(3):387-95.
- Tsai J, Ford ES, Li C, Pearson WS, Zhao G. Binge drinking and suboptimal self-rated health among adult drinkers. Alcohol Clin Exp Res 2010;34(8):1465-71.
- Van Dijk AP, Toet J, Verdurmen JE. The relationship between health-related quality of life and two measures of alcohol consumption. J Stud Alcohol 2004;65(2):241-9.
- Naimi TS, Brewer RD, Miller JW, Okoro C, Mehrotra C. What do binge drinkers drink? Implications for alcohol control policy. Am J Prev Med 2007;33(3):188-93.
- Naimi TS, Nelson DE, Brewer RD. Driving after binge drinking. Am J Prev Med 2009;37(4):314-20.
- Okoro CA, Brewer RD, Naimi TS, Moriarty DG, Giles WH, Mokdad AH. Binge drinking and health-related quality of life: do popular perceptions match reality? Am J Prev Med 2004;26(3):230-3.
- Mokdad AH, Stroup DF, Giles WH; Behavioral Risk Factor Surveillance Team. Public health surveillance for behavioral risk factors in a changing environment. Recommendations from the Behavioral Risk Factor Surveillance Team. MMWR Recomm Rep 2003;52(RR-9):1-12.
- Nelson DE, Holtzman D, Bolen J, Stanwyck CA, Mack KA. Reliability and validity of measures from the Behavioral Risk Factor Surveillance System (BRFSS). Soz Praventivmed 2001;46 Suppl 1:S3-42.
- Nelson DE, Powell-Griner E, Town M, Kovar MG. A comparison of national estimates from the National Health Interview Survey and the Behavioral Risk Factor Surveillance System. Am J Public Health 2003;93(8):1335-41.
- Ounpuu S, Chambers LW, Chan D, Yusuf S. Validity of the US Behavioral Risk Factor Surveillance System’s health related quality of life survey tool in a group of older Canadians. Chronic Dis Can 2001;22(3-4):93-101.
- Centers for Disease Control and Prevention. Health-related quality of life — methods and measures. http://www.cdc.gov/hrqol/methods.htm. Accessed October 4, 2011.
- Gallicchio L, Hoffman SC, Helzlsouer KJ. The relationship between gender, social support, and health-related quality of life in a community-based study in Washington County, Maryland. Qual Life Res 2007;16(5):777-86.
- Ford ES, Mokdad AH, Li C, McGuire LC, Strine TW, Okoro CA, et al. Gender differences in coronary heart disease and health-related quality of life: findings from 10 states from the 2004 Behavioral Risk Factor Surveillance
System. J Womens Health (Larchmt) 2008;17(5):757-68. - Bentley TG, Palta M, Paulsen AJ, Cherepanov D, Dunham NC, Feeny D, et al. Race and gender associations between obesity and nine health-related quality-of-life measures. Qual Life Res 2011;20(5):665-74.
- Moriarty DG, Zack MM, Kobau R.
The Centers for Disease Control and Prevention’s Healthy Days Measures — population tracking of perceived
physical and mental health over time. Health Qual Life Outcomes 2003;1:37. - Chen HY, Baumgardner DJ, Rice JP. Health-related quality of life among adults with multiple chronic conditions in the United States, Behavioral Risk Factor Surveillance System, 2007. Prev Chronic Dis 2011;8(1):A09.
- Heyworth IT, Hazell ML, Linehan MF, Frank TL. How do common chronic conditions affect health-related quality of life? Br J Gen Pract 2009;59(568):e353-8.
- Blumberg S, Luke J. Wireless substitution: early release of estimates from the National Health Interview Survey, January-June 2010. National Center for Health Statistics. http://www.cdc.gov/nchs/nhis.htm. Accessed October 6, 2011.
- Stockwell T, Donath S, Cooper-Stanbury M, Chikritzhs T, Catalano P, Mateo C. Under-reporting of alcohol consumption in household surveys: a comparison of quantity-frequency, graduated-frequency and recent recall. Addiction 2004;99(8):1024-33.
- Nelson DE, Naimi TS, Brewer RD, Roeber J. US state alcohol sales compared to survey data, 1993-2006. Addiction 2010;105(9):1589-96.
- Screening and behavioral counseling interventions in primary care to reduce alcohol misuse. US Preventive
Services Task Force. http://www.uspreventiveservicestaskforce.org/uspstf/uspsdrin.htm. Accessed October 6, 2011. - Elder RW, Lawrence B, Ferguson A, Naimi TS, Brewer RD, Chattopadhyay SK, et al. The effectiveness of tax policy interventions for reducing excessive alcohol consumption and related harms. Am J Prev Med 2010;38(2):217-29.
- Campbell CA, Hahn RA, Elder R, Brewer R, Chattopadhyay S, Fielding J, et al. The effectiveness of limiting alcohol outlet density as a means of reducing excessive alcohol consumption and alcohol-related harms. Am J Prev Med 2009;37(6):556-69.
Tables
 Table
Table
1. Mean Unhealthy Days by Selected Characteristics and Binge Drinking Intensity Among US Adult Binge Drinkers, 2008-2010a
| Characteristic | Nb | Physically Unhealthy Days Mean (95% CI) |
Mentally Unhealthy Days Mean (95% CI) |
|---|---|---|---|
| Women | |||
| Overall | 56,656 | 2.8 (2.7-2.9) | 5.1 (5.0-5.3) |
| Age, y | |||
| 18-44 | 27,262 | 2.5 (2.4-2.6) | 5.4 (5.2-5.6) |
| ≥45 | 29,394 | 3.4 (3.2-3.5) | 4.5 (4.4-4.7) |
| Race/ethnicity | |||
| White non-Hispanic | 46,539 | 2.6 (2.5-2.7) | 4.8 (4.7-4.9) |
| Black non-Hispanic | 3,660 | 3.5 (2.9-4.1) | 7.0 (6.3-7.7) |
| Hispanic | 3,173 | 2.9 (2.5-3.3) | 5.6 (5.0-6.3) |
| Other non-Hispanic | 2,995 | 3.7 (3.2-4.2) | 6.2 (5.5-6.9) |
| Marital status | |||
| Married | 32,766 | 2.4 (2.3-2.5) | 4.3 (4.2-4.5) |
| Previously married | 14,074 | 4.3 (4.1-4.6) | 7.1 (6.8-7.4) |
| Never married | 9,723 | 2.8 (2.5-3.0) | 5.7 (5.4-6.1) |
| Education | |||
| <High school diploma | 3,031 | 5.1 (4.6-5.7) | 8.3 (7.5-9.0) |
| High school diploma | 14,937 | 3.5 (3.3-3.7) | 6.3 (5.9-6.6) |
| Some college or technical school | 17,085 | 2.8 (2.6-3.0) | 5.4 (5.2-5.7) |
| ≥College degree | 21,571 | 1.9 (1.8-2.0) | 3.7 (3.5-3.9) |
| Employment | |||
| Employed | 38,873 | 2.1 (2.0-2.2) | 4.6 (4.4-4.7) |
| Unemployed | 3,960 | 4.4 (3.9-4.8) | 8.6 (8.0-9.1) |
| Homemaker/student | 6,756 | 2.7 (2.4-3.0) | 5.2 (4.9-5.6) |
| Retired | 5,140 | 3.5 (3.2-3.9) | 2.9 (2.6-3.3) |
| Unable to work | 1,851 | 14.0 (12.9-15.2) | 13.4 (12.3-14.5) |
| Income, $ | |||
| <25,000 | 11,178 | 4.9 (4.6-5.2) | 8.1 (7.7-8.5) |
| 25,000 to <50,000 | 13,116 | 2.9 (2.7-3.0) | 5.8 (5.5-6.1) |
| ≥50,000 | 27,977 | 1.9 (1.8-2.1) | 3.7 (3.6-3.9) |
| Largest no. of drinks consumed on any occasion | |||
| 4 | 22,779 | 2.5 (2.3-2.7) | 4.3 (4.1-4.5) |
| 5 | 10,413 | 2.5 (2.3-2.7) | 4.8 (4.4-5.1) |
| 6 | 8,692 | 2.7 (2.4-2.9) | 5.4 (5.1-5.8) |
| ≥7 | 8,559 | 3.2 (3.0-3.4) | 6.9 (6.5-7.2) |
| Men | |||
| Overall | 75,564 | 2.5 (2.4-2.5) | 3.6 (3.5-3.7) |
| Age, y | |||
| 18-44 | 33,850 | 2.1 (2.0-2.2) | 3.8 (3.6-3.9) |
| ≥45 | 41,714 | 3.2 (3.1-3.4) | 3.1 (3.0-3.2) |
| Race/ethnicity | |||
| White non-Hispanic | 62,007 | 2.3 (2.2-2.4) | 3.3 (3.2-3.5) |
| Black non-Hispanic | 3,513 | 3.0 (2.6-3.3) | 4.8 (4.2-5.4) |
| Hispanic | 5,115 | 2.7 (2.4-2.9) | 3.8 (3.4-4.1) |
| Other non-Hispanic | 4,290 | 3.0 (2.6-3.4) | 4.1 (3.6-4.6) |
| Marital status | |||
| Married | 46,761 | 2.1 (2.0-2.2) | 2.9 (2.8-3.1) |
| Previously married | 14,549 | 4.4 (4.1-4.8) | 5.4 (5.1-5.8) |
| Never married | 14,115 | 2.4 (2.2-2.5) | 4.2 (4.0-4.5) |
| Education | |||
| <High school diploma | 5,610 | 4.2 (3.8-4.6) | 5.4 (4.9-5.9) |
| High school diploma | 23,512 | 2.9 (2.7-3.1) | 4.0 (3.8-4.3) |
| Some college | 20,231 | 2.4 (2.2-2.5) | 3.7 (3.5-3.9) |
| ≥College degree | 26,147 | 1.6 (1.5-1.7) | 2.5 (2.3-2.6) |
| Employment | |||
| Employed | 55,499 | 1.8 (1.7-1.9) | 3.0 (2.9-3.1) |
| Unemployed | 5,924 | 3.8 (3.4-4.2) | 6.4 (6.0-6.9) |
| Homemaker/student | 1,780 | 2.0 (1.7-2.3) | 3.7 (3.2-4.2) |
| Retired | 9,603 | 3.7 (3.4-4.0) | 2.3 (2.1-2.6) |
| Unable to work | 2,632 | 14.5 (13.4-15.7) | 11.2 (10.2-12.3) |
| Income, $ | |||
| <25,000 | 12,776 | 4.6 (4.3-4.9) | 5.8 (5.4-6.1) |
| 25,000 to <50,000 | 17,884 | 2.5 (2.3-2.7) | 3.7 (3.5-3.9) |
| ≥50,000 | 40,249 | 1.7 (1.6-1.7) | 2.6 (2.5-2.8) |
| Largest no. of drinks consumed on any occasion | |||
| 5 | 18,863 | 2.2 (2.0-2.3) | 2.8 (2.6-3.0) |
| 6 | 16,292 | 2.3 (2.1-2.5) | 2.9 (2.7-3.1) |
| 7 | 5,454 | 2.0 (1.7-2.2) | 2.8 (2.5-3.1) |
| ≥8 | 26,857 | 2.6 (2.5-2.8) | 4.3 (4.1-4.5) |
Abbreviation: CI, confidence interval.
a Data from 50 states and Washington, DC, 2008-2010 Behavioral Risk Factor Surveillance System. Binge drinking defined as 4 or more drinks for women and 5 drinks or more drinks for men on an occasion.
b Sample sizes vary because of missing values in mentally unhealthy days and physically unhealthy days.
Table
2. Association Between Number of Unhealthy Days and Binge Drinking Intensity by Sex Among Binge Drinkers, 2008-2010a
| Largest No. of Drinks Consumed on Any Occasion |
Physically Unhealthy Days |
Mentally Unhealthy Days | ||
|---|---|---|---|---|
| Predicted Mean (95% CI) | β (P Value) | Predicted Mean (95% CI) | β (P Value) | |
| Women | ||||
| 4 | 2.6 (2.3-2.8) | 1 [Reference] | 4.6 (4.3-4.8) | 1 [Reference] |
| 5 | 2.6 (2.3-2.8) | −0.01 (.97) | 4.8 (4.4-5.2) | 0.24 (.22) |
| 6 | 2.6 (2.3-2.9) | 0.02 (.89) | 5.2 (4.8-5.6) | 0.61 (.004) |
| ≥7 | 3.0 (2.7-3.3) | 0.41 (.009) | 6.3 (5.8-6.7) | 1.69 (.001) |
| Men | ||||
| 5 | 2.1 (1.9-2.3) | 1 [Reference] | 2.9 (2.7-3.2) | 1 [Reference] |
| 6 | 2.3 (2.1-2.6) | 0.19 (.10) | 3.1 (2.8-3.3) | 0.11 (.44) |
| 7 | 2.1 (1.8-2.4) | −0.04 (.78) | 2.8 (2.5-3.1) | −0.16 (.36) |
| ≥8 | 2.6 (2.4-2.7) | 0.42 (<.001) | 4.0 (3.7-4.2) | 1.01 (<.001) |
Abbreviation: CI, confidence interval.
a Data from 50 states and Washington, DC, 2008-2010 Behavioral Risk Factor Surveillance System. Binge drinking defined as 4 or more drinks for women and 5 drinks or more drinks for men on an occasion. Sample size is 46,764 female binge drinkers and 63,223 male binge drinkers. Model adjusted for age, race/ethnicity, education, marital status, income, and employment.
Posted on by